Ethereum is attempting to make a new swing high following a consolidation phase, while Bitcoin has already reached a new all-time high. But is now the right time to buy Ethereum? Let’s dive into a full technical analysis of ETHUSDT.
Ethereum Price Outlook
Ethereum is currently forming a new monthly high. With Bitcoin trading at its all-time high, there is still room for Ethereum to rise before testing its own all-time high. Investors are now wondering whether this is a good time to enter a long position.
In the following section, we’ll analyze Ethereum’s performance and assess whether there is a viable opportunity for investors to open a long position.
Ethereum (ETHUSDT) Daily Chart
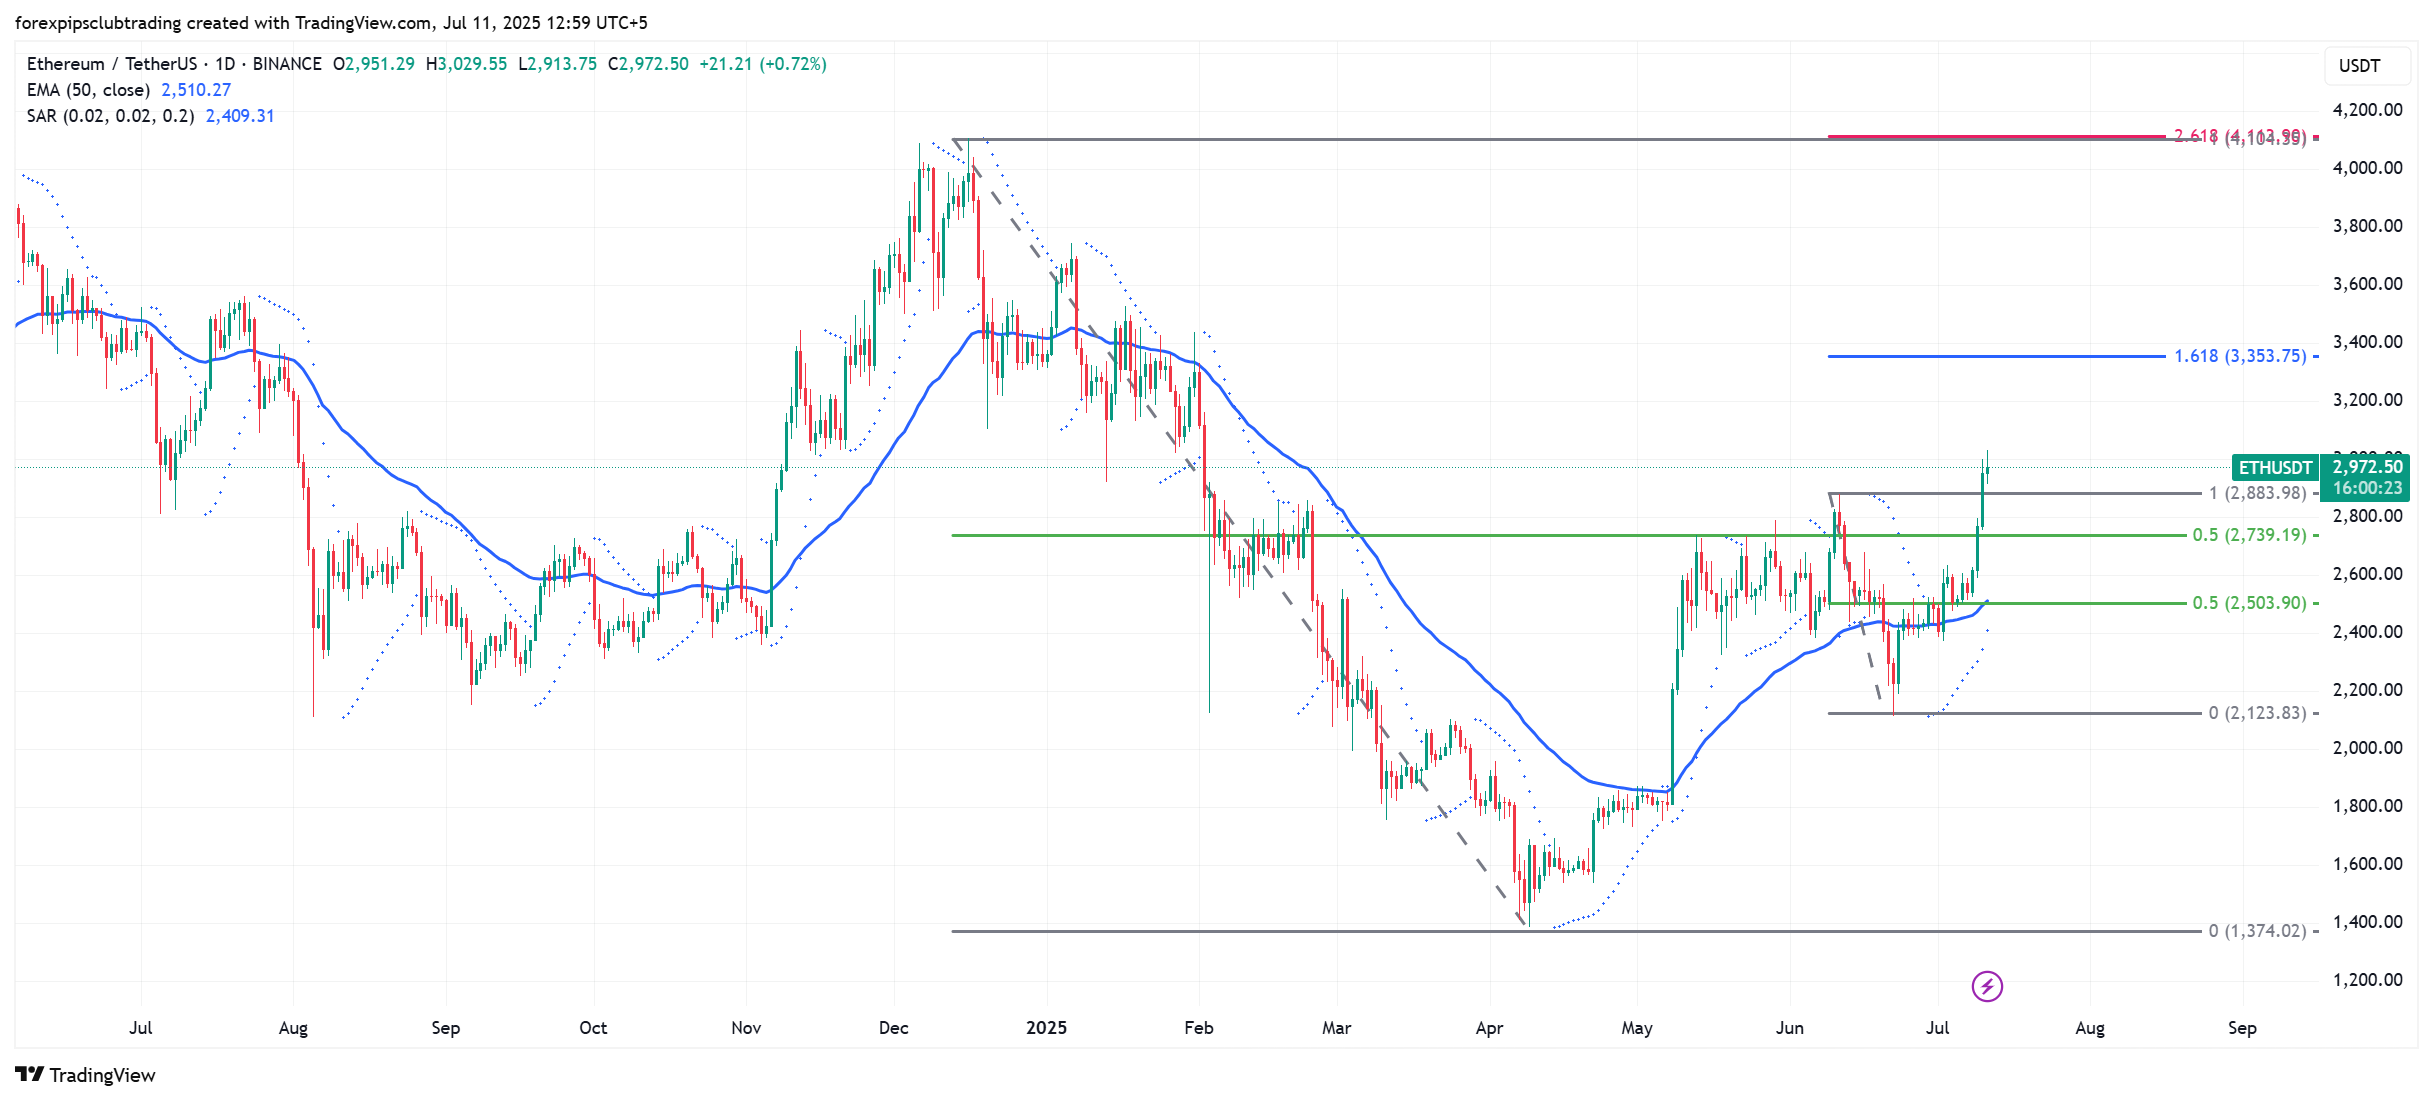
Ethereum is trading with bullish momentum, especially after forming a bottom in April 2025. A strong recovery, characterized by counter-impulsive momentum, has pushed the price above the 50% Fibonacci retracement level of the December-to-April swing.
Instead of forming a bearish correction, the price consolidated near the key Fibonacci level and then continued upward with a new swing high formation.
Supported by strong buying pressure from a fundamental perspective, Ethereum is currently following the trend with a solid liquidity sweep from the 50-day Exponential Moving Average (EMA).
Based on this outlook, the ongoing bullish momentum could extend further, and the price is likely to move toward the $4,000 psychological level.
However, sharp upward moves can be risky, as a necessary corrective move might cause significant short-term losses.
Since the price has shown a bullish breakout from a range-bound market, investors should monitor how it behaves during any potential pullback before targeting the $4,000 level.
The ideal setup would involve a rebound to the demand zone with a bullish reversal signal near the 50-day EMA followed by a Range Breakout Strategy.
On the other hand, if the price fails to hold above the 50-day EMA and shows a bearish correction, it could indicate the presence of retail sellers. In that case, a deeper correction might form, potentially bringing the price down toward the $3,500 support level before the next leg higher.
Ethereum (ETHUSDT) H4 Chart
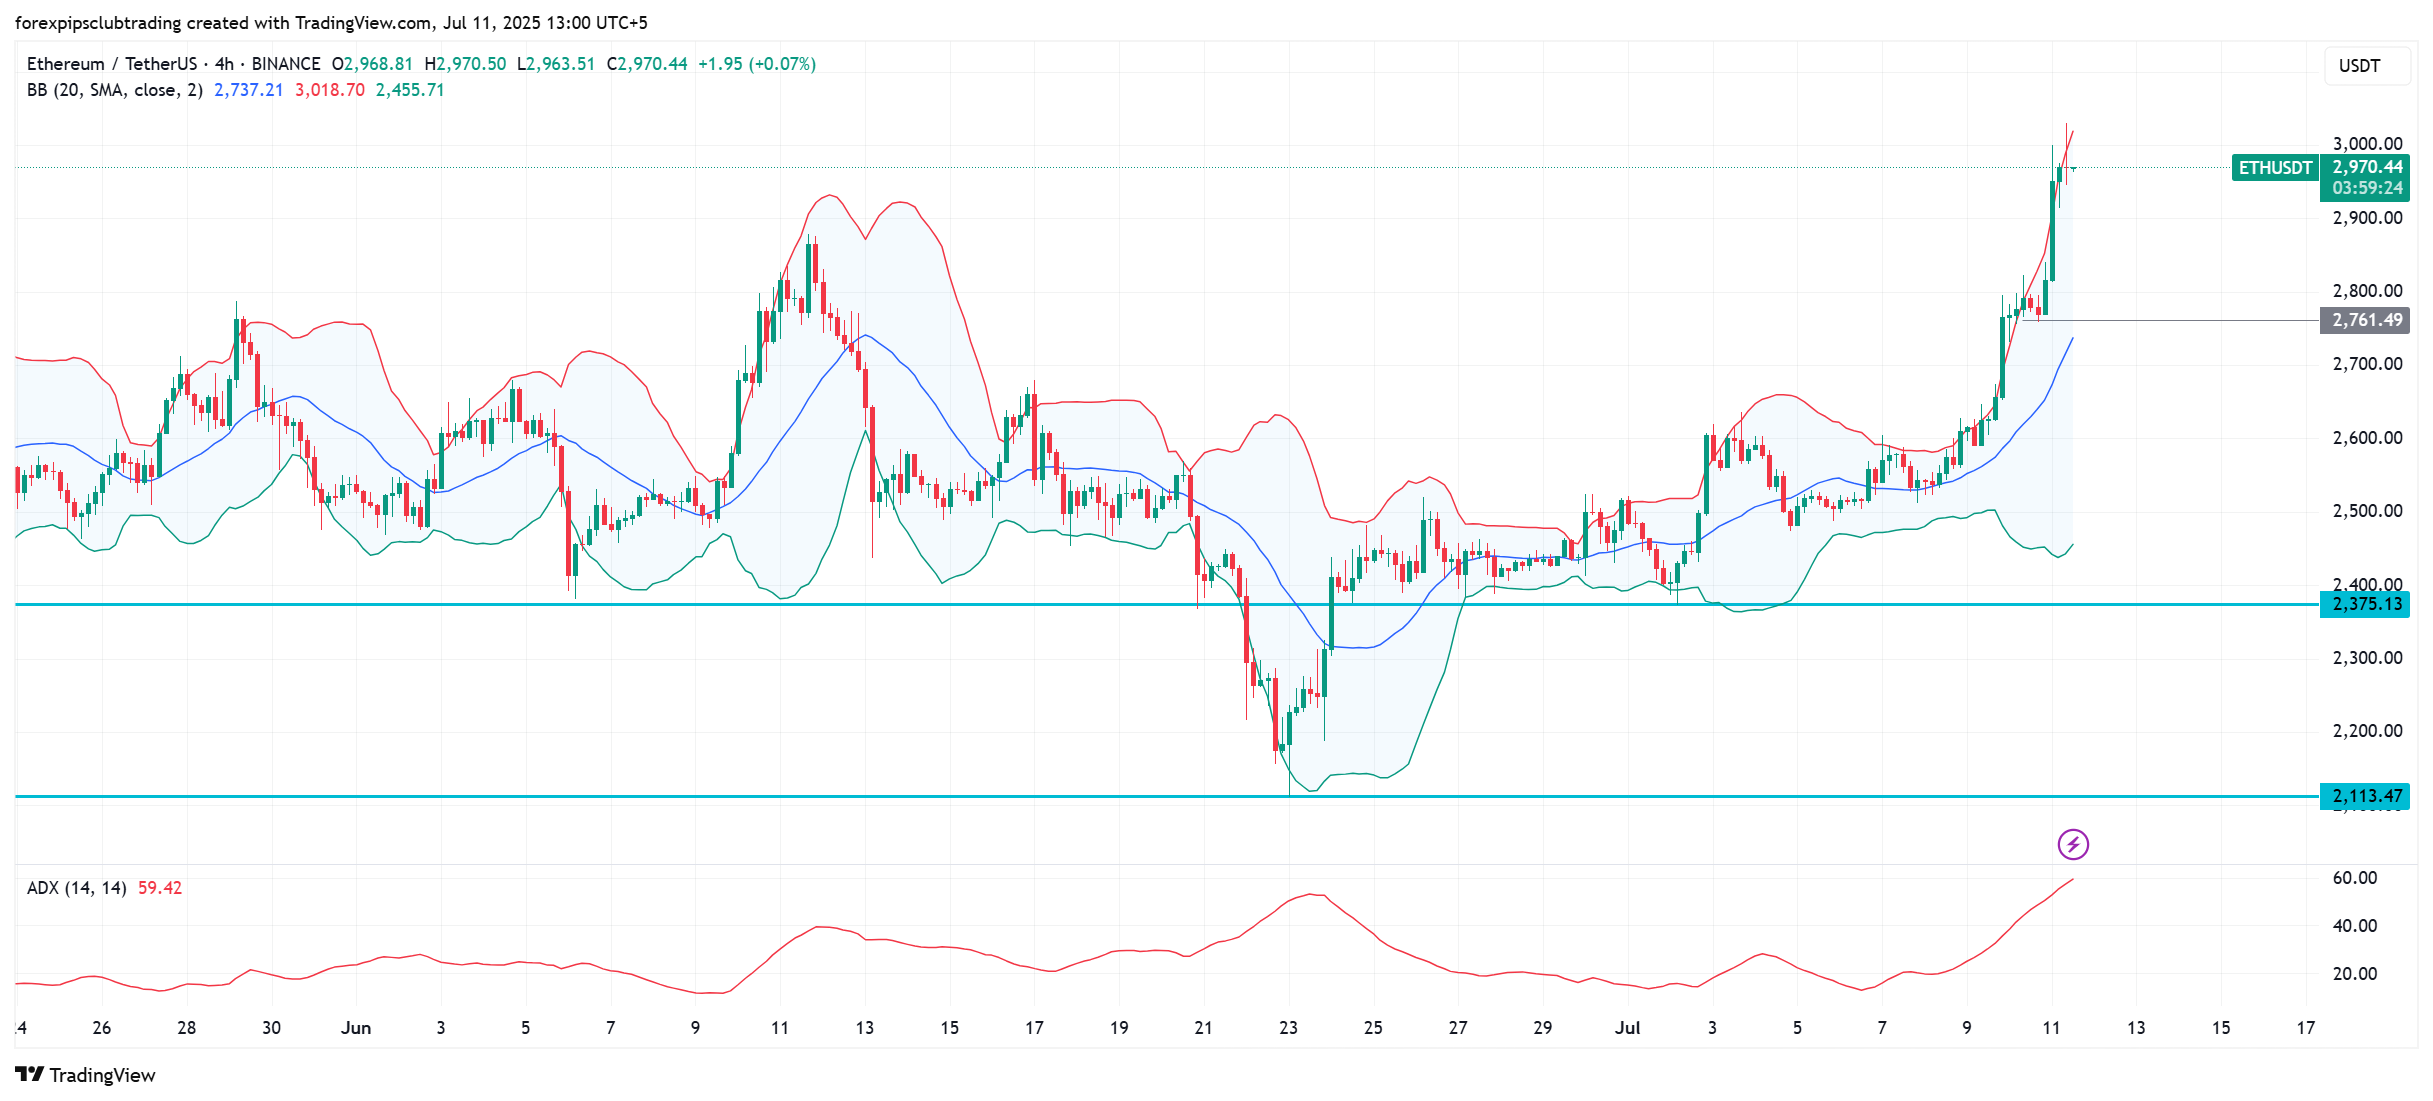
In the 4-hour timeframe, Ethereum appears to be overextended, as the current price is trading above the upper Bollinger Band. At the same time, the Average Directional Index (ADX) has reached its monthly peak, indicating a potentially exhausted trend.
Given this setup, a short-term correction is likely, with the primary target being the midline of the Bollinger Bands.
From a buying perspective, this is not the ideal time to enter a long position since the price is already at a resistance zone. Investors should closely watch for a price retracement. A selling pressure below the $2,531.00–$2,400.00 area could offer a better long entry point.
Conversely, if the selling pressure extends below the mid-Bollinger Band and leads to consolidation, it may invalidate the current bullish outlook and potentially lead to a new swing low below the $2,351.15 level.
Is Ethereum (ETHUSDT) A Buy?
Overall, Ethereum remains in a strong bullish trend with the potential to reach the $4,000 mark. However, uncertainty stemming from geopolitical tensions and global trade dynamics could hinder sustained bullish momentum in the crypto market.
A deeper correction in Ethereum could offer a more favorable buying opportunity—especially if a stable bottom is formed. Investors should remain patient and look for confirmation of support before entering new long positions.

