https://forexpipsclub.com/top-most-profitable-cryptocurrency-trading-strategy-forexpipsclub-guide
The growth rate of Cryptocurrency is so impressive that it has become an attractive asset for small investors to billionaires. So, it’s no wonder crypto investors follow various trading strategies when making trade decisions as other financial investors.
However, trading strategies involve various technical indicators, which depend on market data and different calculations to obtain market context. So, applying a strategy for live trading with a particular level of understanding is wise. We will discuss the top five most profitable Crypto trading strategies below with examples.
Top Most profitable Crypto trading strategies :
- Range Breakout Strategy
- Trend Trading Strategy
- Ichimoku Cloud Strategy
- Golden Cross/Death Cross
- Dollar Cost Averaging (DCA)
Range Breakout Strategy
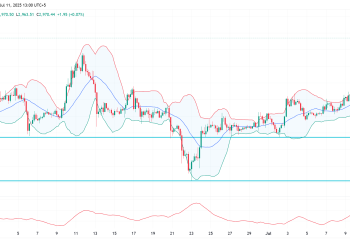
Like any other financial asset, cryptocurrencies also create different patterns when prices move high or low. A breakout usually occurs when the price reaches below support or above resistance levels, enabling opportunities for crypto investors to make significant profits. Breakout is among the primary technical setups financial investors usually follow when making trade decisions.
In the figure above, we see the price move in a range for a certain period and then make a breakout, either breaking above the resistance level or below the support level of a specific price zone.
The main challenge of using a range breakout strategy in crypto investing is to be careful about fakeouts, which can lead to loss. A fake out occurs when the price breaks out of the range but returns immediately.
Fakeout occurs when the trend doesn’t have sufficient volume to change or consolidate, reflecting disappointment in traders’ expectations. However, intelligent investors avoid fakeouts by using effective stop-losses, having the mindset to reverse, and paying extra attention to support-resistance levels.
Trend Trading Strategy
Trend trading refers to making profits by following market momentum in a specific direction. Like many other financial market investors, this method benefits crypto traders; as everyone knows, “Trend is always your friend.” Crypto investors usually use various technical indicators and tools to determine trends alongside trading positions, such as moving averages, momentum indicators, trendlines, and chart patterns.
Moving Averages
Moving averages are common technical indicators to detect trends. Although one moving average is enough to determine the trend direction, smart crypto investors frequently use two or more to identify more accurate trading positions.
For example, you may use SMA 20 on your crypto asset chart. If the price exceeds the SMA line, it declares a bullish force and continues to move upside if the bullish pressure sustains, and vice versa.
Momentum Indicators
You can detect trends using momentum indicators, such as MACD, RSI, Stochastic RSI, ADX, and CCI.
For example, the MACD indicator continues to deliver positive readings, indicating the price is in bullish territory and vice versa when bearish sentiment takes over the price movement.
Trendlines And Chart Patterns
Trendlines are beneficial tools for detecting trends. For example, you can connect lower lows when the price direction is upside, declaring an uptrend. Meanwhile, you can connect higher highs when the price starts moving downward, indicating a downtrend.
The price reaches the trendline when using trendlines, enabling trading opportunities for crypto traders.
Ichimoku Cloud Strategy
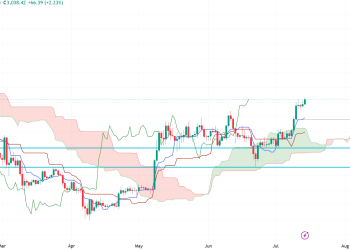
The Ichimoku Cloud is a popular technical indicator that simultaneously reveals various market information through different calculations, including momentum, trend directions, support-resistance levels, and more. When using the Ichimoku Cloud Strategy, you must know its elements and proper guidelines to determine the most desired trading positions.
Ichimoku Cloud elements:
- Tenkan-sen
- Kijun-Sen
- Senkou Span A
- Senkou Span B
- Chikou Span or lagging span
- When the Tenkan-sen line crosses the Kijun-Sen line on the upside, defining bullish pressure on the asset price, and the exact opposite crossover declares bearish pressure.
- The Senkou Span A crosses above the Senkou Span B, declaring a bullish trend, and the cloud color will be green. Meanwhile, the opposite crossover between these lines will indicate a bearish force on the asset price, and the cloud color will be red.
- The Chikou Span, or lagging span line, crosses and remains above the price, indicating bullish trends and vice versa.
However, when applying the Ichimoku Cloud Strategy for crypto trading, traders must check the readings in higher time frames to confirm the trend direction and use proper money management.
Golden Cross/Death Cross
Golden cross and death cross are straightforward methods for crypto trading. They deliver the most valuable results on a daily chart using the 200 SMA and 50 EMA.
When the 50 EMA line crosses above the 200 SMA line, it indicates that the price may be entering a bullish trend, which is the golden cross. The opposite crossover between these moving averages is the death cross, which declares a bearish force on the asset price.
In most cases, traders place stop loss below or above the first swing points of the Golden or Death crossover.
Dollar Cost Averaging (DCA)
Dollar Cost Averaging (DCA) is another method most used by financial investors. It involves purchasing assets periodically with a specific amount, which applies to many financial assets, including cryptocurrencies, forex, stocks, commodities, and more.
For a better understanding, check the charts below:
With Dollar Cost Averaging (DCA)
| Time | Amount | Asset Price | Quantity |
| Week 1 | $100 | $2 | 50 |
| Week 2 | $100 | $2 | 50 |
| Week 3 | $100 | $1.5 | 66.6 |
| Week 4 | $100 | $1.75 | 57.14 |
| Week 5 | $100 | $2 | 50 |
| Total | Average cost | Total | |
| $500 | 1.82 | 273.74 |
Without Dollar Cost Averaging (DCA)
| Time | Amount | Asset Price | Quantity |
| Week 1 | $500 | $2 | 250 |
| Week 2 | 0 | $2 | 0 |
| Week 3 | 0 | $1.5 | 0 |
| Week 4 | 0 | $1.75 | 0 |
| Week 5 | 0 | $2 | 0 |
| Total | Average cost | Total | |
| $500 | $2 | 250 |
There is no way to know when the best time to buy an asset is. So, the DCA method is valuable. It allows making profits for an extended period and overcoming emotions. If the market turns against the order, the investor may likely feel regret if a large sum is at stake. It prevents investors from investing a significant amount in a single trade. It is also possible that the trader only comes in the third week and makes a considerable profit with 333.33 pieces of the asset.
Final Note
Finally, these are among the most profitable crypto trading strategies. We suggest mastering any trading signal before applying it to live trading. Again, don’t forget to use proper money management before entering any trade using these methods.


