
50 Day Moving Average Trading Strategy: How to Calculate and Use
Moving average is a standard indicator for financial traders. From novice to professional traders frequently use this indicator to obtain market data and predict the future movement. A 50-day moving average is a standard parameter on any financial asset chart, and traders choose this parameter for its remarkable positive features.
However, it is mandatory to learn the functionalities when preparing a complete trading method using any technical indicator with a particular parameter. In this article, we will discuss the 50-Day moving average, how to use it for successful trading. Later, we will list the top pros and cons to reveal potentiality.
What is the 50-Day moving average?
Moving average is a straightforward indicator for financial traders. Several types of moving averages are available such as Simple moving average, Weighted moving average, Exponential moving average, etc. Moreover, you can use different parameters of price candles such as opening, closing, highs, lows, etc., besides setting different values of the MA line. Financial traders use some most popular periods moving averages such as 20-Day MA, 50-Day MA, 100-Day MA, 200-Day MA, etc.
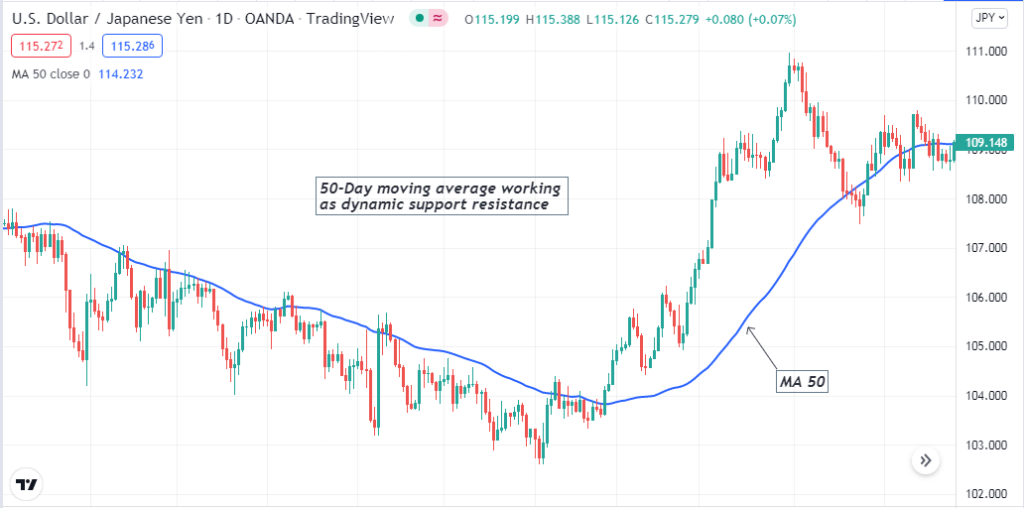
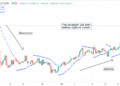
The 50-Day moving average on a daily chart of USD/JPY
So you may be thinking about which value is the best to use in trading. The answer is simple; there is none that exists as the best value. Because it always depends on the market context and timeframes alongside methods. In that case, the 50-Day moving average is the king for a healthy trend. The calculation concept is simple, add 5o candles closing price and divide it by 50 to get the average price.
How to use a 50-Day moving average for trading strategy
The 50-Day moving average is suitable for any trading instrument that shows support resistance levels in the D1 chart. You can use it to determine trends, support resistance levels, or even use it to identify entry/exit points of trades. For example, the price crosses above the 50-Day MA line and remains above it; it stays on an uptrend. Every time price touches the MA line and bounces back on the upside declares buying opportunities. You can use it as a standalone indicator or combine it with other technical tools and indicators to create sustainable trading methods.
A short-term trading strategy
We use the 50-Day MA to determine the trend in our short-term trading method. Then we use the ADX and support resistance levels to spot entry/exit points of trades. Trade executions occur by following some simple steps:
- Determine the current trend using the 50-Day MA on the daily chart.
- Mark supports resistance levels, weekly, monthly open-high-long-closing, and historical levels from upper timeframe charts.
- Seek entry/exit points on a 15-min or hourly chart using the ADX and the basic levels you draw on upper timeframe charts.
Bullish trade scenario
Confirm the current trend is bullish from the daily chart as the price crosses and remains above the 50-Day MA.
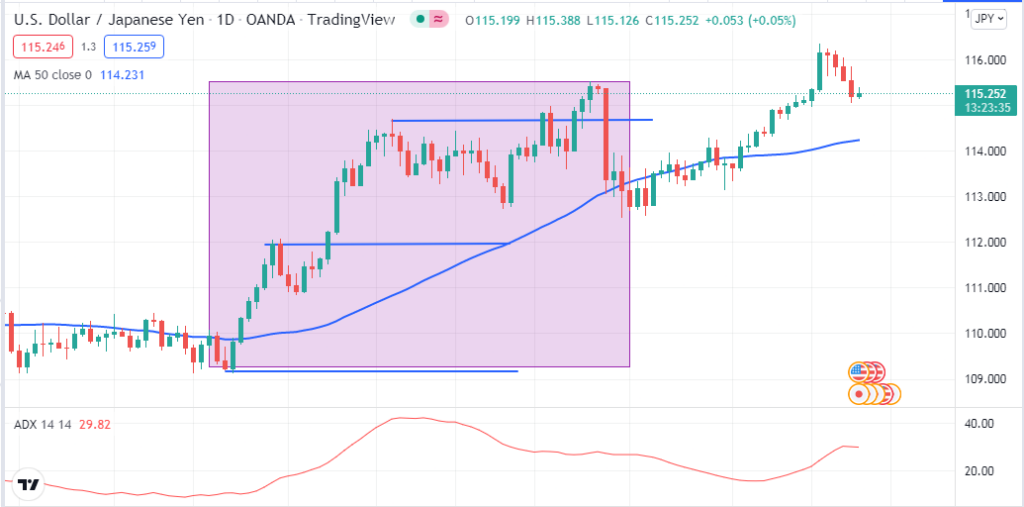
Bullish trend and support resistance levels on a daily chart
Then seek open buy positions at lower time frame charts when
- The price breaks above any support resistance level or bounces back on the upside from any support level.
- The ADX value is above 20.
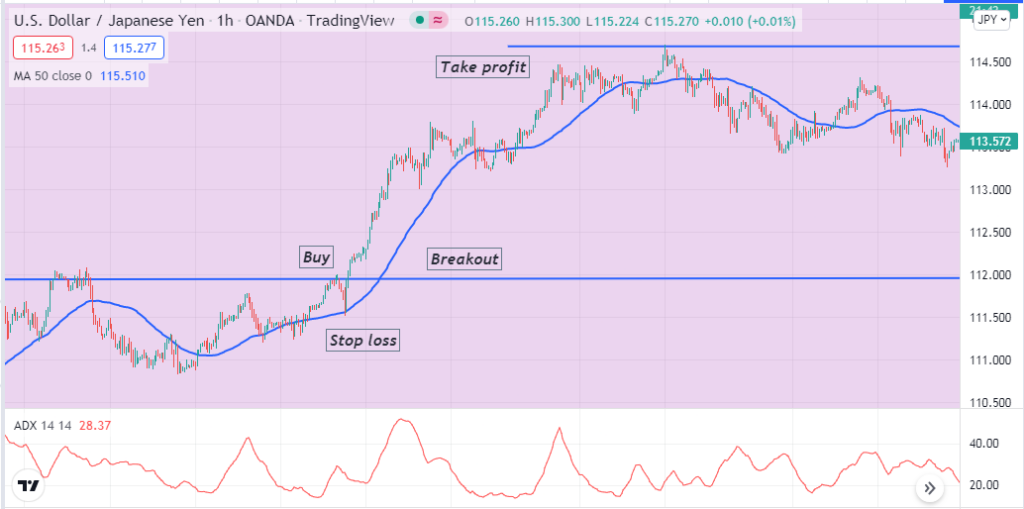
Bullish setup
Entry
Match these conditions above and open a buy position.
Stop loss
The initial stop loss is below the breakout or the support level.
Take profit
The initial profit target will be below the next resistance level. You can continue the buy order if a further breakout occurs on the upside.
Bearish trade scenario
Confirm the current trend is bearish from the daily chart as the price crosses and remains below the 50-Day MA.
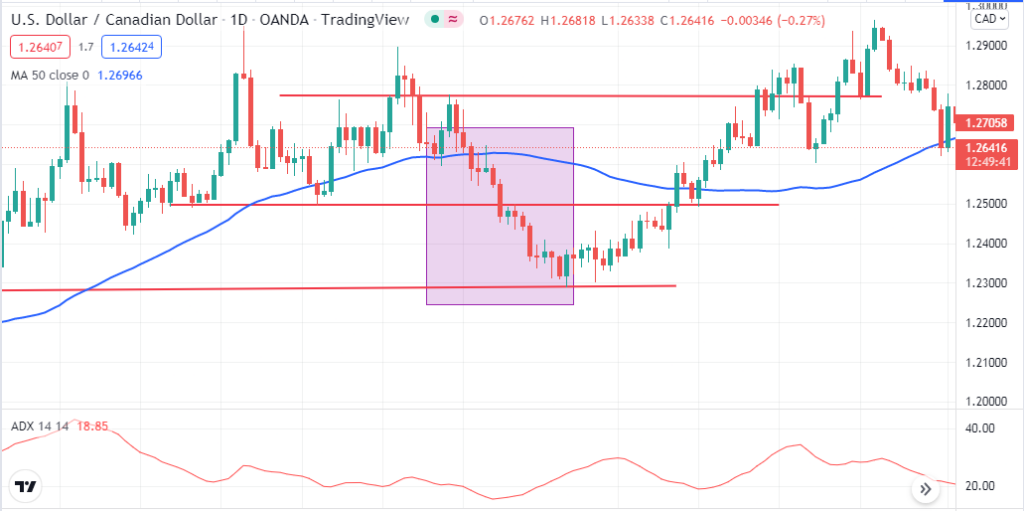
Bearish trend and support resistance levels on a daily chart
Then seek open sell positions at lower time frame charts when:
- The price breaks below any support resistance level or declines back from any resistance level on the downside.
- The ADX value is above 20.
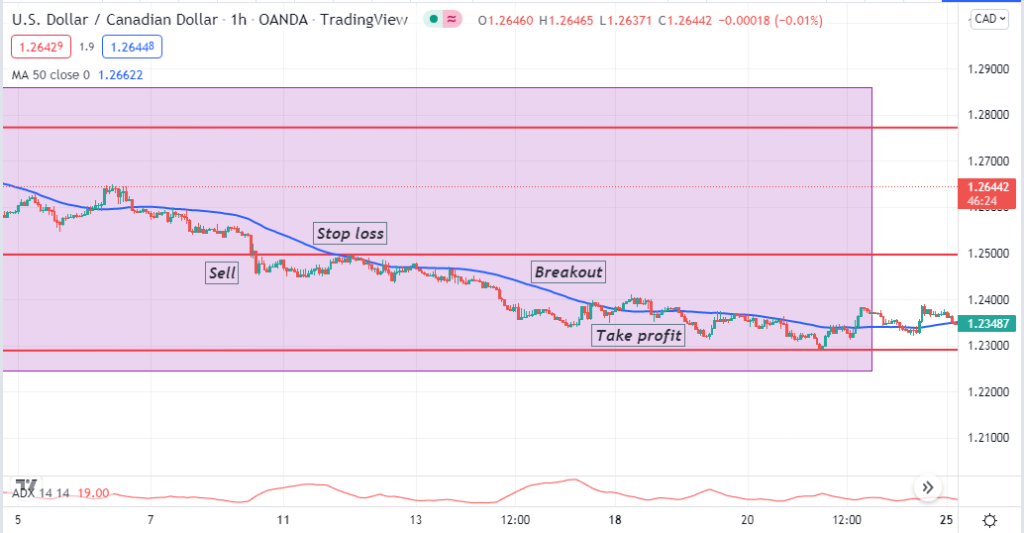
Bearish setup
Entry
Match these conditions above and open a sell position.
Stop loss
The initial stop loss is above the breakout or the resistance level.
Take profit
The initial profit target will be above the next support level. You can continue the sell order if a further breakout occurs on the downside.
A long-term trading strategy
We use the famous golden cross and death cross concepts alongside the MACD indicator. It uses two moving averages, EMA 50 and EMA 200. When the EMA 50 crosses above the EMA 200 line, it declares bullish momentum, which you can consider a golden crossover. On the other hand, the exact opposite is the death crossover that claims bearish momentum. This method suits the daily time frame chart.
Bullish trade scenario
When a golden crossover occurs, observe the MACD window:
- The dynamic blue line crosses above the dynamic red line on the MACD window.
- Green histogram bars take place above the central line of the MACD window.
Bullish setup
Entry
These conditions above indicate sufficient bullish pressure on the asset price. Place a buy order here.
Stop loss
Place an initial stop loss below the recent swing low.
Take profit
Continue the buy order till the bullish momentum remains intact. Close the buy order when the death crossover occurs between the EMA lines.
Bearish trade scenario
When the death crossover occurs, observe the MACD window
- The dynamic blue line crosses below the dynamic red line on the MACD window.
- Red histogram bars take place below the central line of the MACD window.
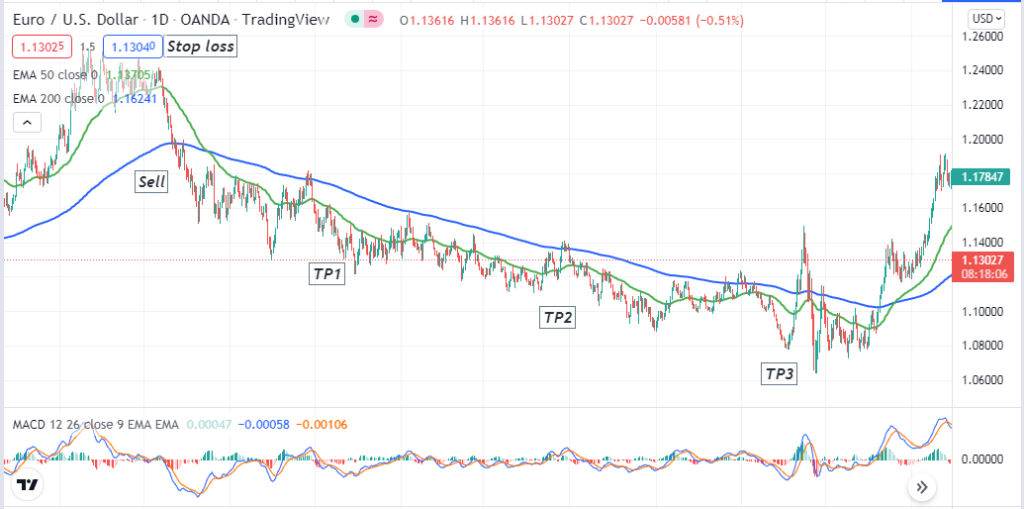
Bearish setup
Entry
These conditions above indicate sufficient bearish pressure on the asset price. Place a sell order here.
Stop loss
Place an initial stop loss above the recent swing high.
Take profit
Continue the sell order till the bearish momentum remains intact. Close the sell order when the golden crossover occurs between the EMA lines.
Pros and cons
| Pros | Cons |
| It determines good support resistance levels. | Using the 50-Day MA as a standalone indicator is not a wise idea. |
| Allow making many sustainable trading strategies. | This indicator can fail due to fundamental reasons. |
| It applies to many trading assets. | Some technical analysts reckon that Moving averages are not a good indicator for predicting the future movement as the market doesn’t have memory. |
Final thought
Finally, the 50-Day moving average is a widely acceptable parameter to financial traders for its positive results. You can execute constantly successful trades by implementing these strategies using the 50-Day moving average. We recommend using proper money and trade management concepts while using these methods.