
3 White Soldiers Candlestick Pattern: Why Is It Always Profitable?
Price candles are one of the essential elements of the financial market. Among line charts, bar charts, and candlestick charts, most traders and investors choose the candlestick chart to analyze. Candles leave footprints of the price movements, so it becomes easier to predict the future movement by following many candlestick patterns. The three white soldiers pattern is a popular candlestick pattern that is always profitable.
However, it requires identifying the pattern and using procedures of any pattern when you decide to use that to execute successful trades. In this article, we describe the three white soldiers pattern. Additionally, it includes trading methods using this pattern with chart attachments.


What is the three white soldiers pattern?
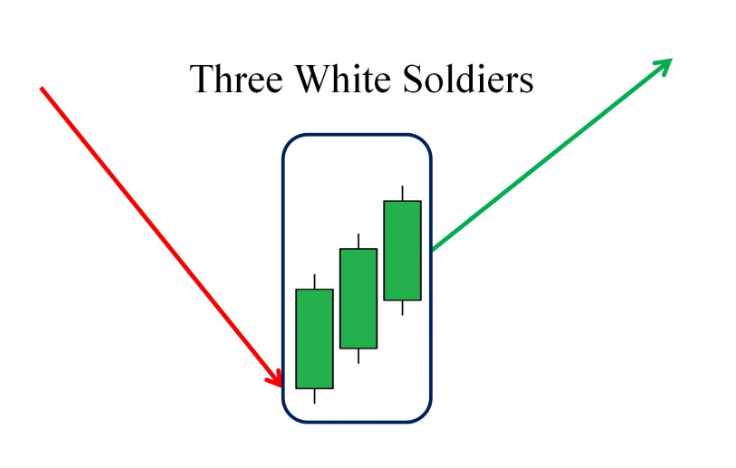
The three white soldiers pattern is a multi candle formation that contains three bullish candles. It signals an upcoming bullish pressure on the asset price by appearing at the finish line of any downtrend price movement. The three white soldiers pattern is most potent near any support level.
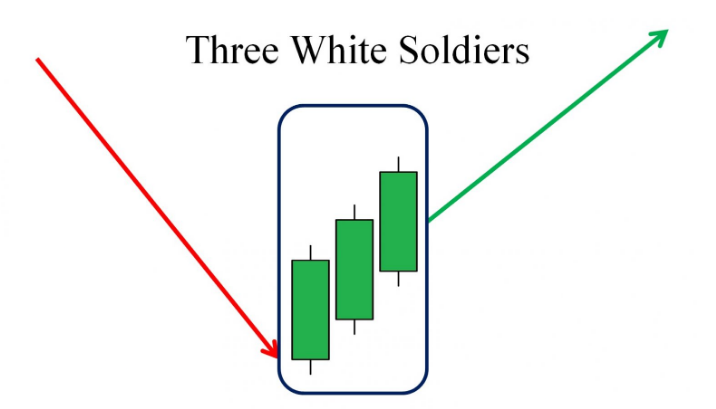
The three white soldier concept
The formation of this pattern is the exact opposite of the three black crows pattern. The first candle of this pattern is bullish after a bearish price movement. The second candle opens near the ending of the first candle and closes above it. The third candle is similar to the second candle that opens near the ending of the second candle and closes above it.
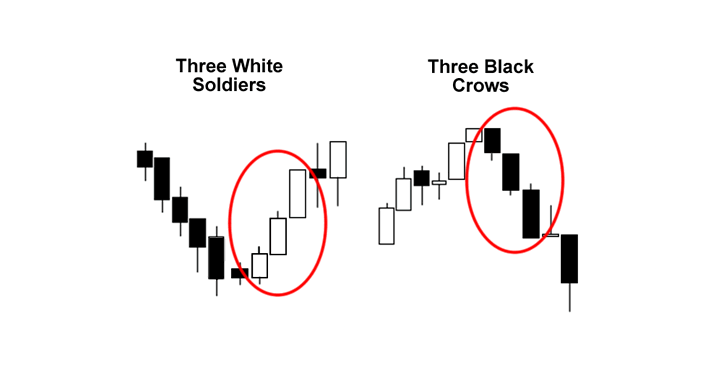
Different three white soldiers formations
Historically this pattern has many conditions, such as all candles will be bullish with no or tiny wicks. Nowadays, traders and investors ignore those involving facts as three bullish candles in a row declare the market context enough to get the idea of buyers’ domination on the asset price.
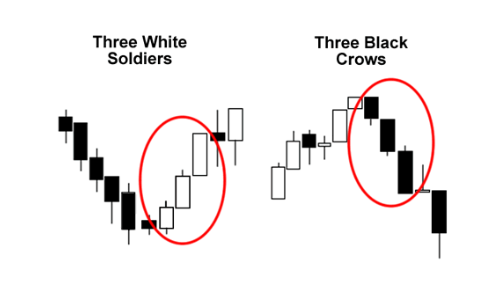
Different multi candle patterns
How to trade using the three white soldiers pattern
The three white soldiers pattern is easy to identify. It is a standard formation on any chart of financial instruments. When you want to execute trades using this pattern, better mark the pattern near any support level as the potentiality is at the peak of this pattern near any support level. You can combine the market context with the pattern to generate trade ideas.
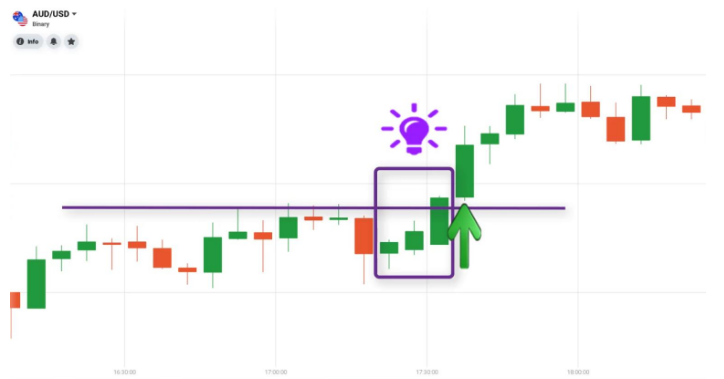
Trading concept
Many traders use technical tools and indicators with this pattern to get complete trade setups. Traders often use support resistance, MACD, ADX, Moving averages, RSI, Stochastic oscillator, Fibonacci retracements, etc., to generate trade ideas. For example, you may mark the three white soldiers pattern near any support level. The price may break above a short-term resistance while completing the formation. So it can move sideways or continue to move more upside. While you will use other supporting tools or indicators, it will be easier to mark entry/exit points of trades.
A short-term trading strategy
While using this short-term trading strategy requires having skills to identify support resistance levels besides identifying the candlestick pattern. Additionally, this trading method contains a HAM 20 line to get more precious trading positions. It is a short-term trading method, so we recommend using charts between 1min to hourly. The preferable chart is a 15-min chart. Besides support, resistance levels mark the historical and essential levels such as weekly-monthly opening, closing, high, low, etc.
Bullish trade scenario
Mark those levels and apply the HMA 20 on your target asset chart.
Entry
Open a buy position when
- The three white soldiers pattern completes formation near any support level.
- The HMA line sloping on the upside.
- The price closes above the HMA line.
- Price breaks above any of your marking levels.
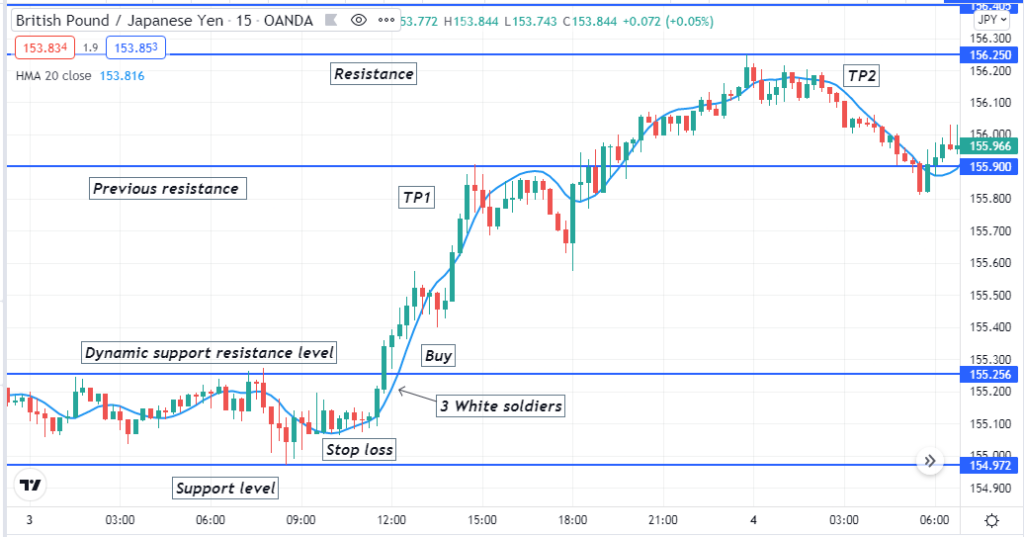
Bullish setup
Stop loss
Set an initial stop loss below the current support level where the price starts to bounce on the upside.
Take profit
The profit target will be below the nearest resistance level. You can continue the buy order depending on the market context. For example, the price breaks above the resistance level and continues upward. Close the buy order if the HMA line starts to slop downside.
Bearish trade scenario
Mark those levels and apply the HMA 20 on your target asset chart. You need to mark three black crows to execute successful sell orders.
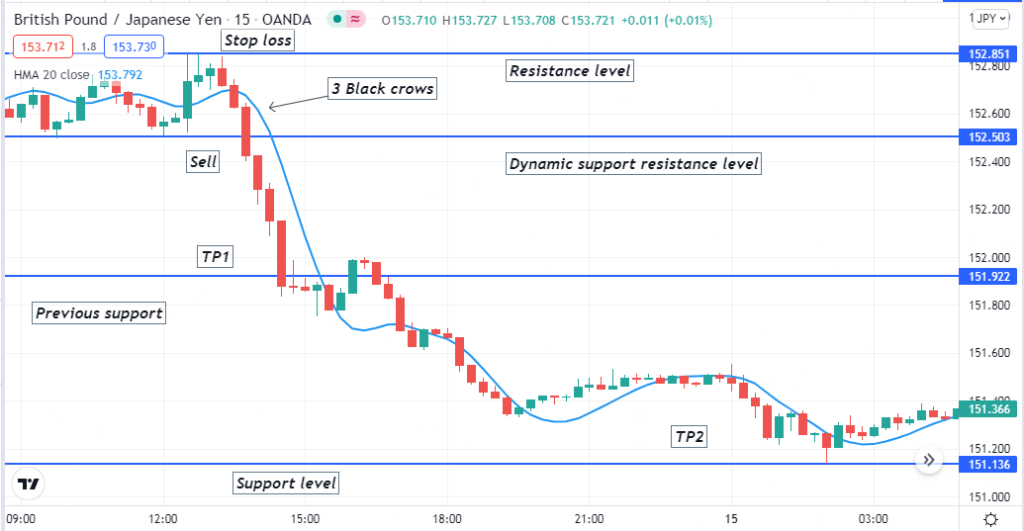
Bearish setup
Entry
Open a buy position when
- The three black crows pattern completes formation near any resistance level.
- The HMA line sloping on the downside.
- The price closes below the HMA line.
- Price breaks below any of your marking levels.
Stop loss
Set an initial stop loss above the current resistance level where the price starts to decline on the downside.
Take profit
The profit target will be above the nearest support level. You can continue the sell order depending on the market context. For example, the price breaks below the support level and continues downward. Close the sell order if the HMA line starts to slop upside.
A long-term trading strategy
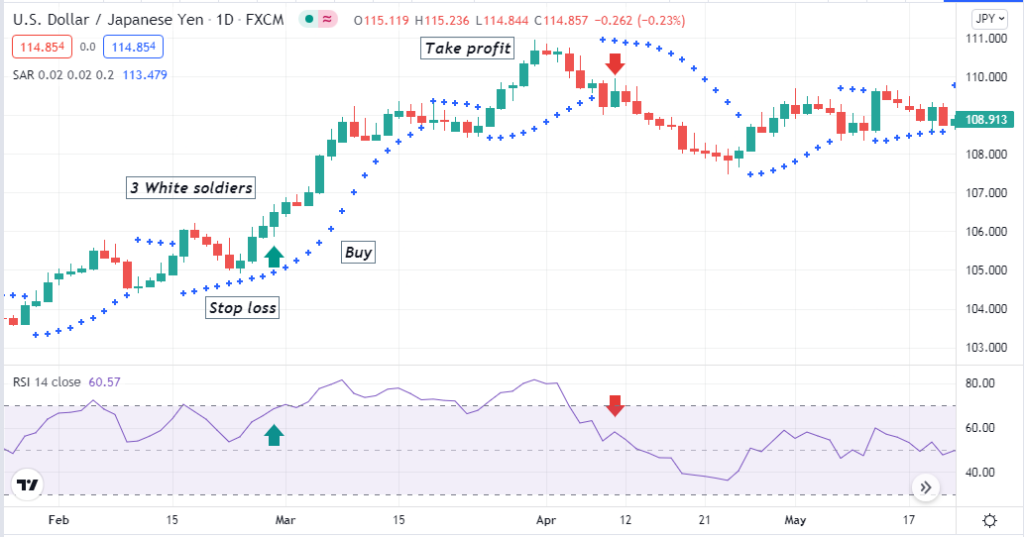
This long-term trading method uses the two most popular technical indicators, the parabolic SAR and the RSI, besides the candlestick pattern. This methods suits any trading asset chart. We recommend using an H4 or D1 chart to catch potential long-term trades using this trading method.
Bullish trade scenario
Apply those indicators on your chart and seek buy opportunities.
Bullish setup
Entry
Place a buy order when
- The three white soldiers pattern completes formation near any support level.
- The dynamic RSI line is at or above the central (50) line that moves toward the upper (80) line.
- Parabolic dots take place below price candles.
Stop loss
The initial stop loss level will be below the current swing low.
Take profit
Close the buy order when
- Parabolic dot shifts on the upside of price candles.
- The dynamic RSI line moves toward the central (50) line after reaching the upper (80) line or above.
Bearish trade scenario
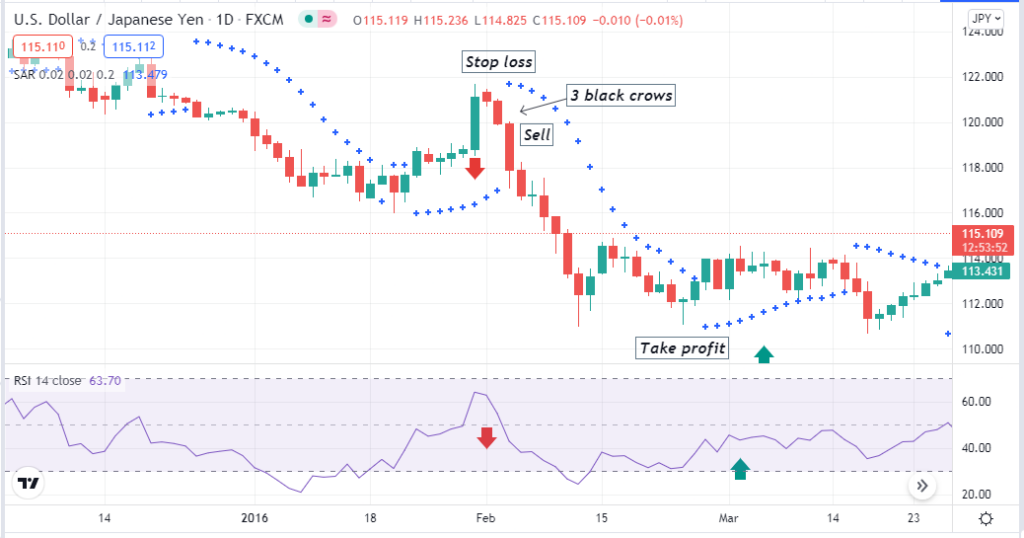
Apply those indicators on your chart and seek sell opportunities. For selling opportunities, three black crows is the pattern that you should seek.
Bearish setup
Entry
Place a buy order when
- The three black crows pattern completes formation near any resistance level.
- The dynamic RSI line is at or below the central (50) line that moves toward the lower (20) line.
- Parabolic dots take place above price candles.
Stop loss
The initial stop loss level will be above the current swing high.
Take profit
Close the sell order when
- Parabolic dot shifts on the downside of price candles.
- The dynamic RSI line moves toward the central (50) line after reaching the lower (20) line or below.
Pros and cons
The top three pros using the three white soldiers pattern are
- It is a typical pattern in the financial market.
- This pattern allows executing of both short-term and long-term trades.
- Identifying this pattern is easy.
The top three cons are
- This pattern can fail due to fundamental reasons.
- It requires using other indicators and tools to get complete trade setups.
- It requires particular skills to combine other market contexts with this pattern to determine entry/exit positions.
Final thought
This article describes all essential info about the typical pattern, three white soldiers. We hope you find this article sufficiently informative and educative to make trade decisions through this pattern. Many other indicators and tools are available to make precious trading methods such as MACD, MA crossovers, Stochastic oscillator, etc.