

Arnaud Legoux Moving Average (ALMA) is a new addition to the group of Moving averages. Moving Average concept got massive popularity among financial investors for its attractive functionalities such as availability, simplicity, effectiveness, etc. It makes sense that this indicator is helpful to generate trading ideas on crypto assets as cryptocurrencies are digital tradable assets with similar parameters to other financial assets.
However, when using ALMA for crypto trading, it is mandatory to learn the basic concept to obtain the best results. The calculation is different from other technical indicators of the same (MA) group. This article will discuss the ALMA indicator and trading strategies using this indicator with chart attachments for better understanding.
What is ALMA?
The ALMA is a technical tool that aims to provide more reliable trading signals by reducing noise or ignoring smaller price movements through its unique calculation. Dimitrios Kouzis Loukas and Arnaud Legoux are the developers of this indicator and the creation period is 2009. Traditional MA lines usually smooth out trendlines, determine support resistance levels, trend strength, etc.
ALMA indicator
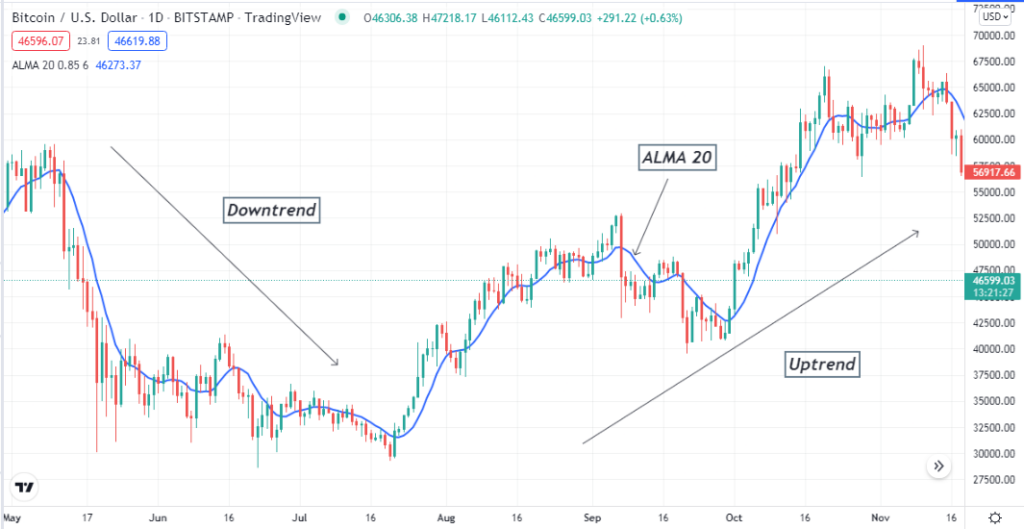
The ALMA indicator uses MA twice uniquely and effectively to generate trade ideas. ALMA uses MA from left to right and right to left to obtain the market data more efficiently. The creation purpose of this trading indicator is to reduce lags and weaknesses of other MAs such as SMA, EMA, SMMA, etc.
How to trade crypto using ALMA?
Now that you know the concept of ALMA, you can use it on any financial asset, including crypto. Any crypto investor can use ALMA to determine support resistance levels, trends, trend switching points, etc. For example, you may use an ALMA (30) line to determine support resistance levels. When the price reaches above the ALMA line, it declares a bullish momentum, and conversely, the price goes below the ALMA line stating bearish pressure on the asset price. Moreover, you can use the crossover concept as other MA indicators to generate trade ideas by determining trend switching points. Crypto investors can use these concepts independently to identify trading positions or combine the indicator readings with other indicators for confirmation to choose more efficient and potential trading positions.
Short-term trading strategy
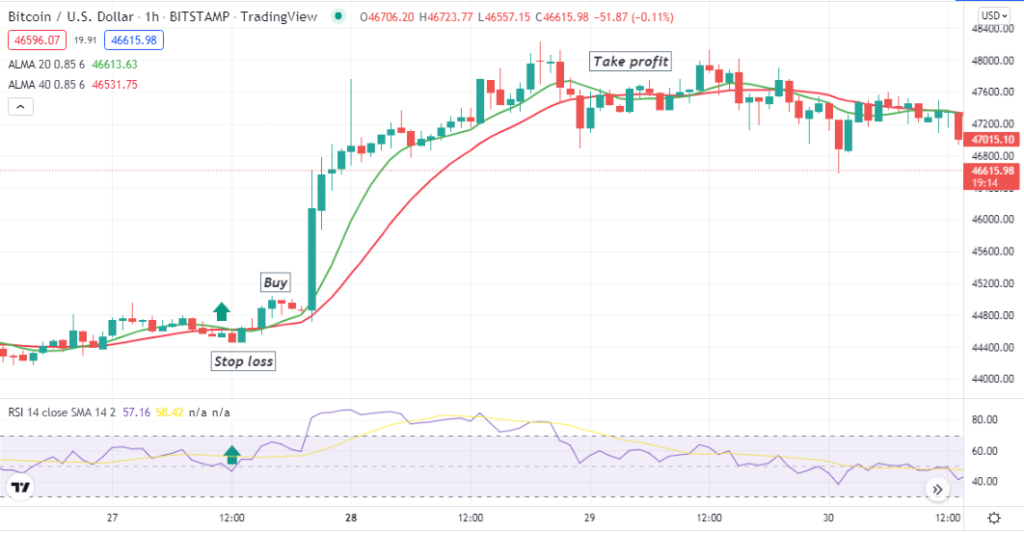
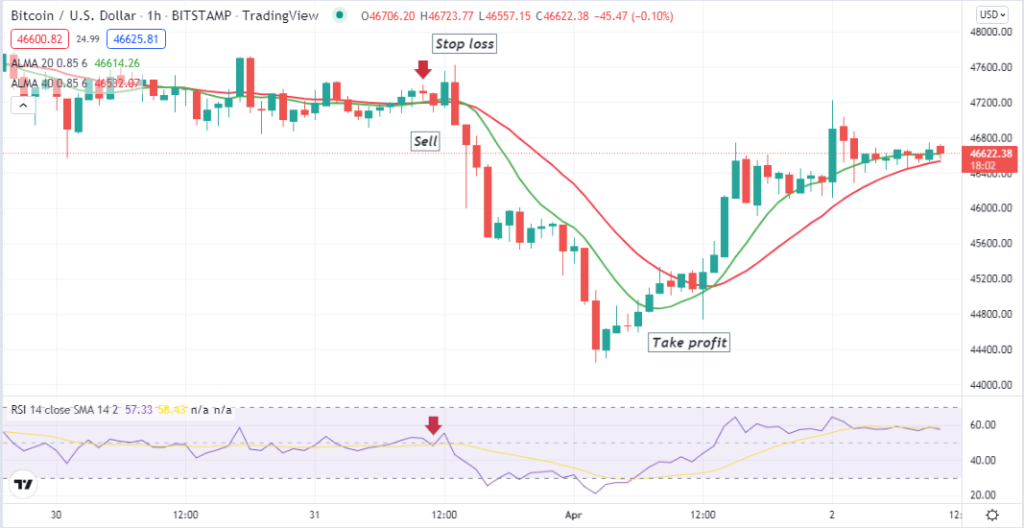
We use two different ALMA parameters and the RSI indicator to generate trade ideas when generating short-term trading positions. We use ALMA 20 (green) and ALMA 40 (red) lines and crossover between these lines to identify entry/exit points of trades. Then we check the readings of the RSI indicator for confirmation of the price direction. We recommend using a 15min or Hourly chart to obtain the best results through this short-term trading method.
Bullish trade scenario
When seeking to enter buy positions, observe-
- The Green ALMA line surpasses the red ALMA line on the upside.
- Both ALMA lines are heading on the upside.
- The RSI dynamic line is near the central (50) line and heading toward the upper (70) level.
Bullish setup
Entry
Match these conditions above and open a buy position.
Stop loss
Place an initial stop loss below the recent swing low with a buffer of 15-10pips.
Take profit
You may continue your buy order till the price remains on the bullish trend. Close the buy position when-
- The Green ALMA line drops below the red ALMA.
- Both ALMA lines are heading on the downside.
- The RSI dynamic line reaches above the upper (70) level or starts moving on the downside after getting that level.
Bearish trade scenario
When seeking to enter sell positions, observe-
- The Green ALMA line surpasses the red ALMA line on the downside.
- Both ALMA lines are heading on the downside.
- The RSI dynamic line is near the central (50) line and heading toward the lower (30) level.
Bearish setup
Entry
Match these conditions above and open a sell position.
Stop loss
Place an initial stop loss above the recent swing high with a buffer of 15-10pips.
Take profit
You may continue your sell order till the price remains on the bearish trend. Close the sell position when-
- The Green ALMA line reaches above the red ALMA.
- Both ALMA lines are heading on the upside.
- The RSI dynamic line reaches below the bottom (30) level or starts moving on the upside after getting that level.
Long-term trading strategy
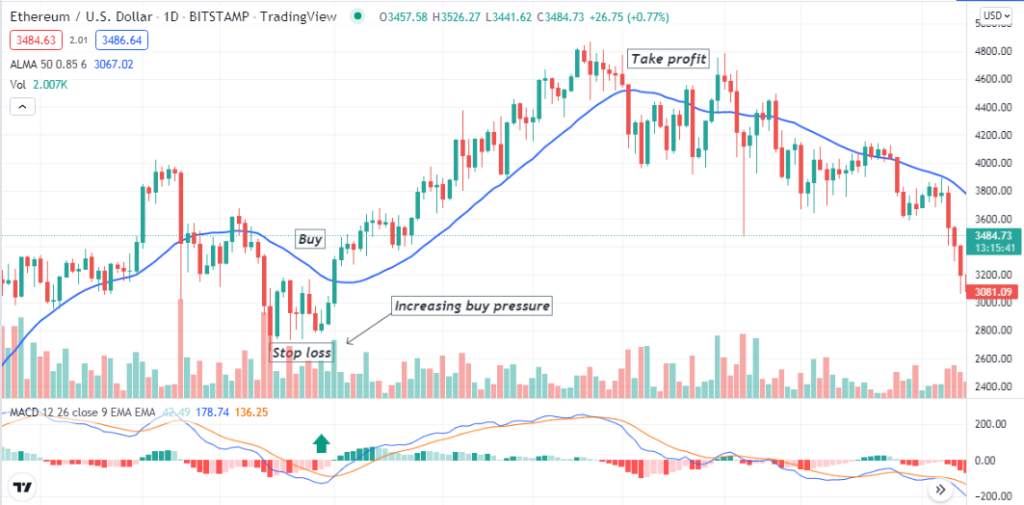
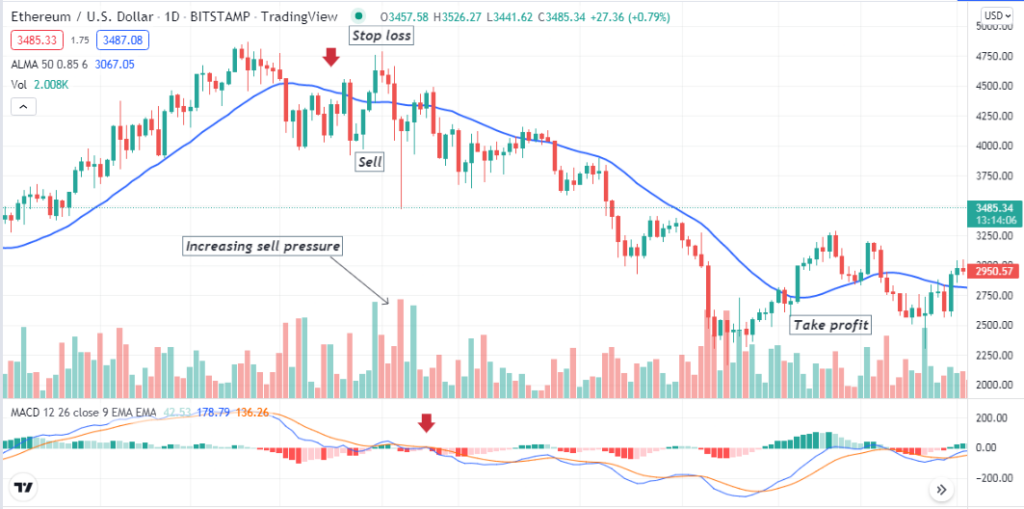
We use the MACD and the volume indicator alongside an ALMA line of 50 periods in this trading method. As you seek long-term trading positions, we recommend using a daily or an H4 chart to analyze and determine entry/exit points.
Bullish trade scenario
Seek to open buy positions when-
- The price reaches above the ALMA line.
- The volume indicator declares an increasing buying pressure.
- The dynamic blue line of the MACD indicator window goes above the dynamic red line.
- MACD green histogram bars take place above the central line.
Bullish setup
Entry
Match these conditions above and open a buy position.
Stop loss
Place a stop loss below the current bullish momentum.
Take profit
Close the buy order when-
- The price reaches below the ALMA line.
- The volume indicator declares seller domination on the asset price.
- MACD red histogram bars take place below the central line.
Bearish trade scenario
Seek to open sell positions when-
- The price reaches below the ALMA line.
- The volume indicator declares an increasing selling pressure.
- The dynamic blue line of the MACD indicator window goes below the dynamic red line.
- MACD red histogram bars take place above the central line.
Bearish setup
Entry
Match these conditions above and open a sell position.
Stop loss
Place a stop loss above the current bearish momentum.
Take profit
Close the sell order when-
- The price reaches above the ALMA line.
- The volume indicator declares buyers’ domination on the asset price.
- MACD green histogram bars take place above the central line.
Pros and cons
| Pros | Cons |
| ALMA offers a smoother line and is less affected by temporary price swings. | ALMA indicator only depends on technical info while ignoring many other fundamental factors. |
| ALMA indicator suits many trading assets. | This indicator generates false trading signals in the ranging market condition. |
| ALMA indicator is simple and attractive enough to use for any crypto investor. | ALMA is a lagging indicator like other technical indicators. |
Final thought
In this article we have seen the detailed trading process using the Arnaud Legoux MA Crypto Strategy. We suggest following proper trade and money management rules while trading crypto with these ALMA indicator strategies.