
Adam and Eve Pattern Forex Trading Strategy
The Adam and Eve pattern represents a price movement that leaves footprints through candle formations in the financial market. In general, financial traders rely on many candlestick formations while making trade decisions. Understanding those candle formations enable traders to determine more accurate trading positions. The adam and eve pattern is on the list of the most effective chart patterns.
However, many candlestick patterns generate different trading signals appearing on various phases of price movements. So it requires understanding the formations besides knowing professional participants’ interactions to execute successful trades using any pattern. This article will introduce you to Adam and Eve patterns, including successful trading strategies using these unique patterns.
What are “Adam and Eve” patterns?
The “Adam and Eve” are typical formations of price candles for various trading instruments. The definitions of these patterns include Thomas Bulkowski’s Encyclopedia Of Chart Patterns. You can spot two different adam and eve patterns in the financial market: the adam and eve top and the adam and eve bottom.
Adam and eve top
The adam and eve top has an inverted “V” shape in the initiation after a sharp rise or bullish trend, which is the Adam. Later, some decline occurs, then the price increases and creates an inverted “U” shape or round shape, the Eve. An Adam and Eve top pattern signals an upcoming reversal and complete formation when combining these two shapes.
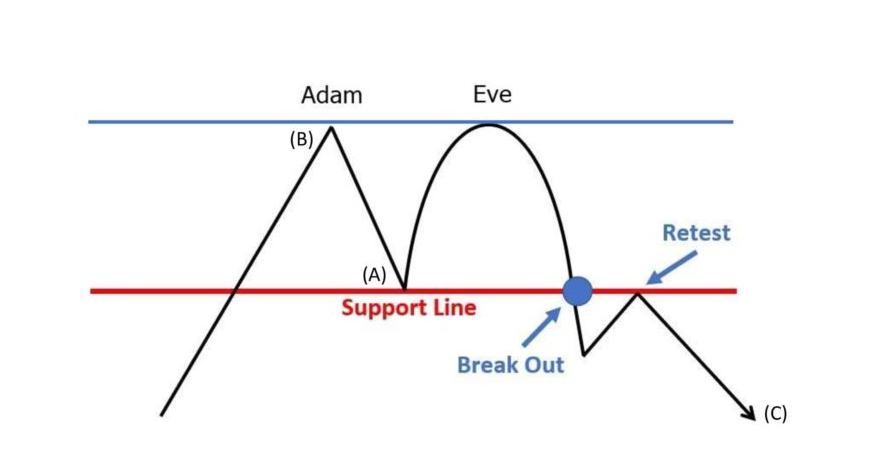
Adam and eve top
Adam and Eve bottom
The adam and eve bottom appearance is the exact opposite of the adam and eve top formation. That has a “V” shape at the initiation stage after a straight decline; it is the Adam part. Later the price creates a round or “U” shape that completes the pattern, which is the Eve part.
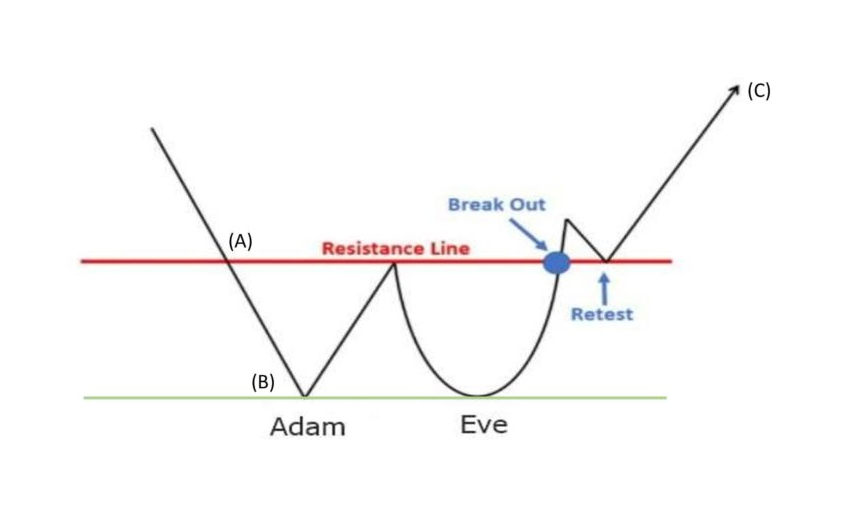
Adam and eve bottom
In both cases, it is allowable that the “Eve” is not at the same level as adam. The eve top can be a slight downside than the adam peak, and meanwhile, the adam low can be more downside than the Eve low on the adam and eve bottom pattern.
How to trade using adam and eve patterns
When the complete formations occur, there will be a neckline on every A&E pattern, either “Adam and Eve top” or “Adam and eve bottom.” The price breaks above or below that level declare signals to enter trades, as simple as that. For example, an Adam and Eve bottom pattern creates a neckline during the formation of the top/peak after the “V” formation. When the price reaches above the neckline after the round shape, it declares a bullish pressure on the asset price and signals to open a buy position. You can use technical indicators and combine the market context to catch trades with more potential.
A short-term trading method
We use volume and the RSi indicator to confirm and identify entry/exit points in this short-term trading method. First, we recognize the pattern and then combine these technical indicators reading as confirmation before executing any trade. When using this method to catch short-term trades, try to enter the market during London or U.S sessions as in these periods liquidity increases and assets get sufficient volatility.
Best time frames to use
This method suits any time frame chart. We recommend using a 15-min chart to determine precious short-term trading positions.
Entry
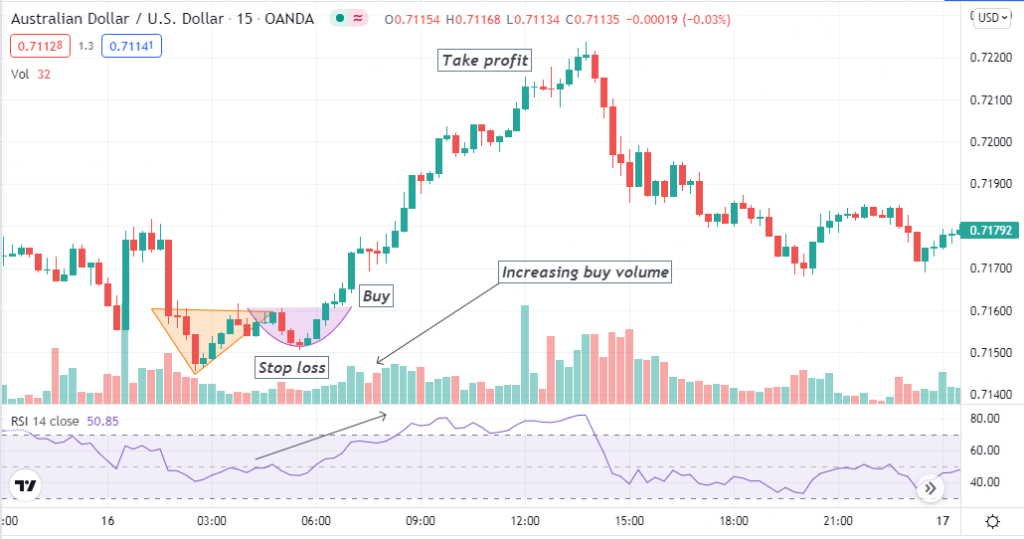
Bullish setup
Observe the price movement after a downtrend ends and spot an adam and eve bottom. Then when a breakout occurs, check the buy volume increases and the RSI line is above the central line (50), heading on the upside. Enter a buy order.
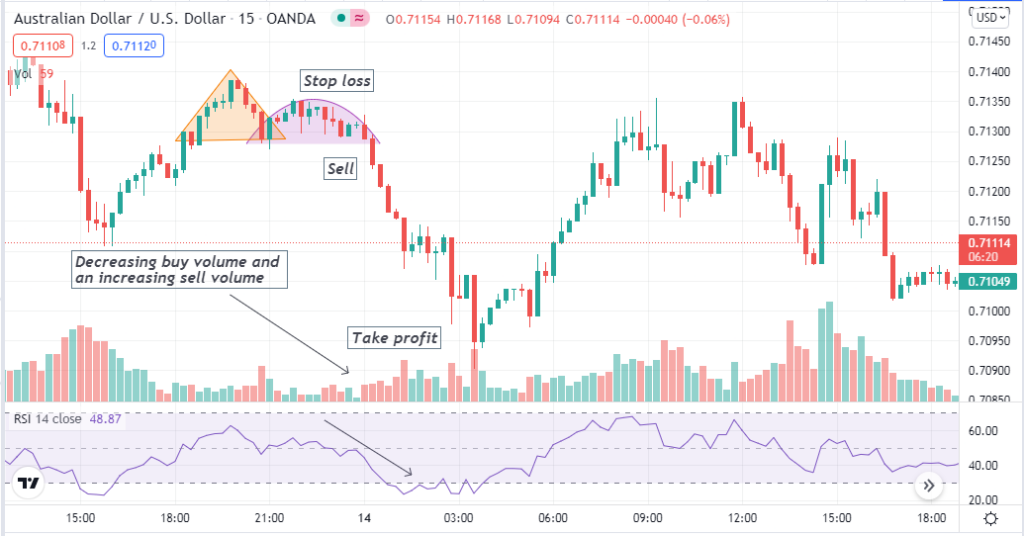
Bearish setup
Meanwhile, spot an adam and eve top near the finish line of an uptrend and check indicators readings. Sell volume increases, and the RSI line is below the central (50) line heading on the downside; this method suggests opening a sell position.
Stop loss
When opening a buy order, the initial stop loss level will be below the Eve low and above the Eve high when opening a sell order through this trading method.
Take profit
Close the positions when the market starts to move against your trade directions. When sell volume increases and the price begins to decline, exit from your buy trade and close the sell trade when buying volume increases.
A long-term trading strategy
This trading method includes EMA crossover and the MACD indicator to generate trade ideas besides “Adam and eve” patterns. We use EMA of 50 (red) and EMA 200 (blue) periods. When the blue EMA line crosses above the EMA blue line, it is a golden crossover that signals an uptrend. Meanwhile, when the red EMA line crosses the blue EMA line on the downside, a death crossover declares declining pressure on the asset price.
Best time frames to use
This method generates the best trading signals on a daily chart.
Entry
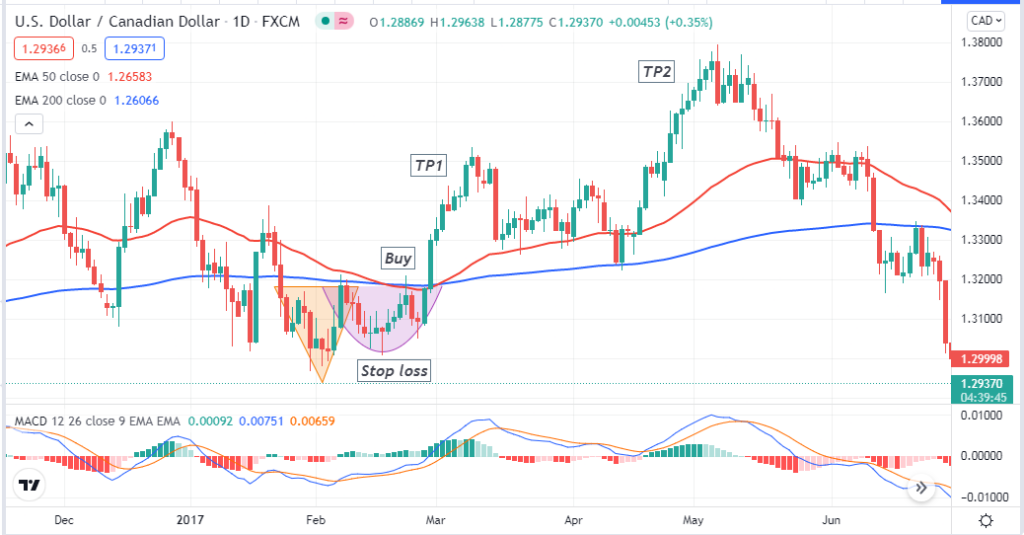
Bullish setup
Check the indicator readings before entering a buy trade spot, an adam and eve bottom near any support level. Place a buy order after matching these conditions below after the price breaks above the neckline:
- Golden crossover between the EMA lines.
- The dynamic blue line crosses above the dynamic red line on the MACD window.
- MACD green histogram bars take place above the central line.
Bearish setup
Meanwhile, spot an adam and eve pattern near any resistance level and match these conditions below when placing a sell order after breakout below the neckline:
- Death crossover between the EMA lines.
- The dynamic blue line crosses below the dynamic red line on the MACD window.
- MACD red histogram bars take place below the central line.
Stop loss
Place reasonable stop loss for your trades. It will be above the Eve high when placing a sell order, and when opening a buy position, the stop loss level will be below the eve low.
Take profit
Close trades with maximum profits according to the market context. Close your trades when your strategy detects opposite momentum against your order type.
Pros and cons
| Pros | Cons |
| The winning percentage is satisfactory for these patterns. | These patterns don’t suggest complete trade setups. |
| This pattern applies to many trading assets. | It requires using other technical tools and indicators to create comprehensive trading strategies. |
| This pattern allows making both short-term and long-term trading positions. | These patterns can fail due to many fundamental reasons. |
Final thought
Adam and Eve patterns are among the most effective patterns in the financial market. We suggest checking on fundamental events from reliable sites before opening any positions and avoiding trading currencies during major fundamental events such as interest rate decisions, GDP, GNP, employment reports, etc.