
Technical indicators are a vital element to many financial traders. These indicators generate trading signals by calculating the market data in several ways. The parabolic SAR is one of the most popular technical indicators that financial investors and traders choose.
However, it is worth learning why any trading indicator is best to trade using that indicator besides the functionality and uses. In this article, we describe the parabolic SAR. It includes a complete description of the parabolic SAR indicator and trading strategies using this indicator with chart attachments. Later, we list the top advantages and limitations of this indicator.
What is parabolic SAR?
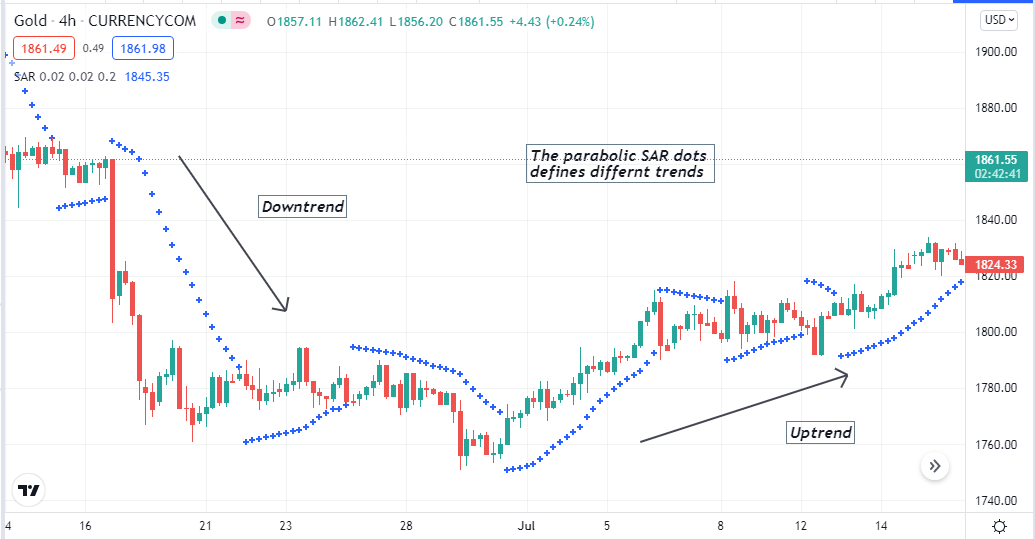
The parabolic SAR is a standard technical indicator that determines the trend and the swing points, so traders use it to make entries/exits for successful trades. SAR stands for “stop and reverse”. The developer of this indicator is the same as another popular indicator, the RSI, J. Welles Wilder Jr. The parabolic SAR is defined by creating a series of dots above or below price candles. These dots take place below price candles on uptrends; meanwhile, you can mark them above price candles on a downtrend.
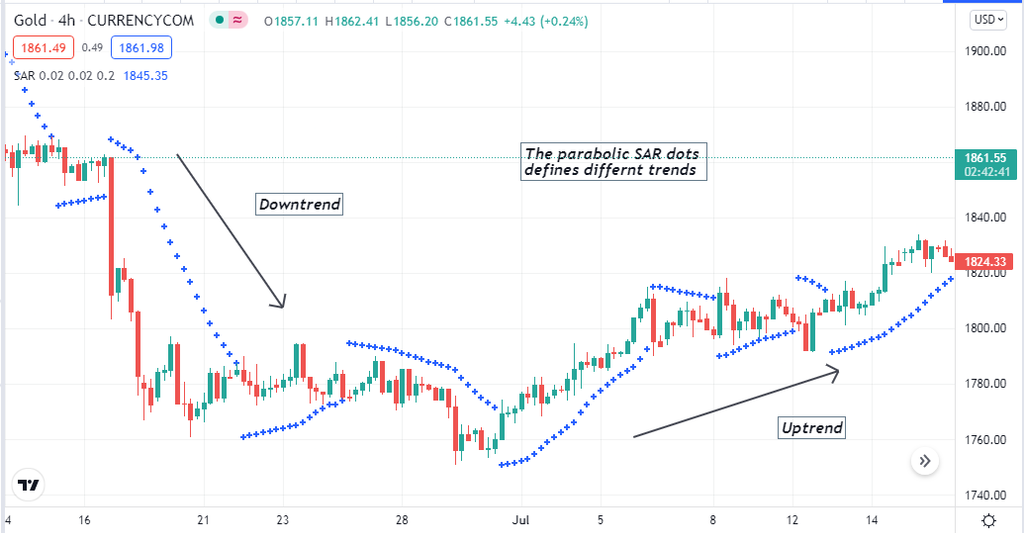
Parabolic SAR on a Gold H4 chart
When the price movement creates a valid swing, high dots occur above price candles, signaling a possible downtrend and vice versa. You can group this indicator among the most popular momentum indicators list. Parabolic SAR has become popular for its easily applicable and other positive features.
How to trade using the parabolic SAR indicator
Trading is easy with the parabolic SAR. Moreover, this indicator applies to any tradable financial asset such as commodities, forex pairs, stocks, etc. It generates excellent trading ideas on any timeframe, so you can trade using this indicator for the short-term or long-term. Although this indicator is potential for any trend direction, it is better to use it on a trendy price movement to obtain excellent results and get more precious entry/exit positions. Many traders combine this indicator reading with other technical indicators and tools to get more accurate trading positions.
A short-term trading technique
We use moving average convergence divergence (MACD) beside the parabolic SAR in our short-term trading technique. MACD is another popular indicator that illustrates market context on an independent window that contains histogram bars of different colors on different sides or a central line besides two (red and blue) dynamic lines. The dynamic blue line crosses the dynamic red line indicates buyer’s domination and vice versa for the opposite crossover between these two lines. This strategy suits fine on any timeframe; we recommend using a 15 min or above chart to seek short-term trading positions. Confirm the current trend by looking at H4 or daily charts.
Bullish trading scenario
Seek buy orders when
– The parabolic SAR dot takes place below price candles.
– The dynamic blue line crosses the dynamic red line on the upside.
-MACD green histogram bars take place above the central line.
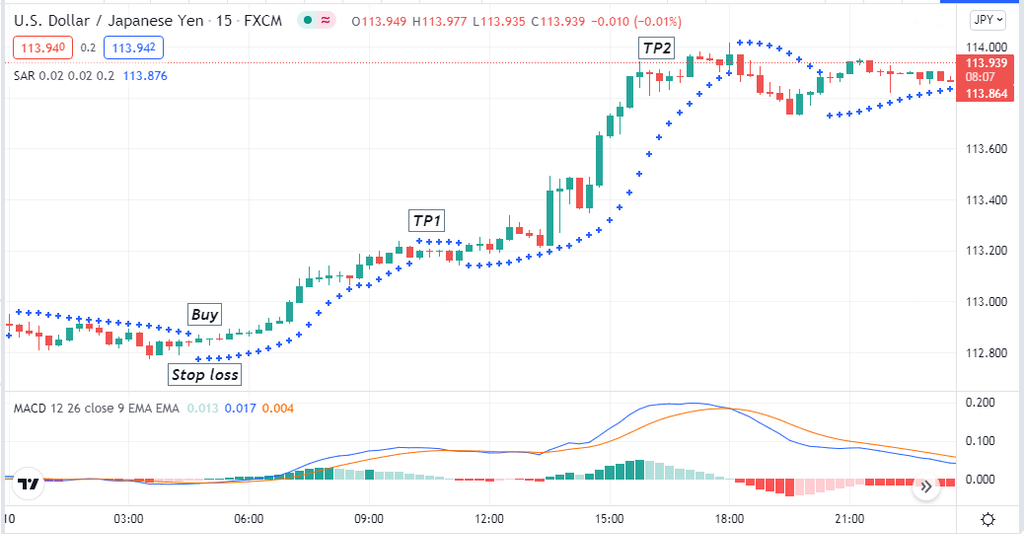
Bullish setup
Entry
When these conditions above match with your target asset chart, place a buy order.
Stop-loss
The initial stop loss level will be below the current swing low.
Take profit
Continue the buy order till the current trend remains intact. Close the buy order when
– The parabolic SAR dot flips above price candles.
-The dynamic blue line crosses the dynamic red line on the downside at the MACD window.
– MACD red histogram bars take place below the central line.
Bearish trade scenario
Seek sell orders when
– The parabolic SAR dot takes place above price candles.
– The dynamic blue line crosses the dynamic red line on the downside.
-MACD red histogram bars take place below the central line.
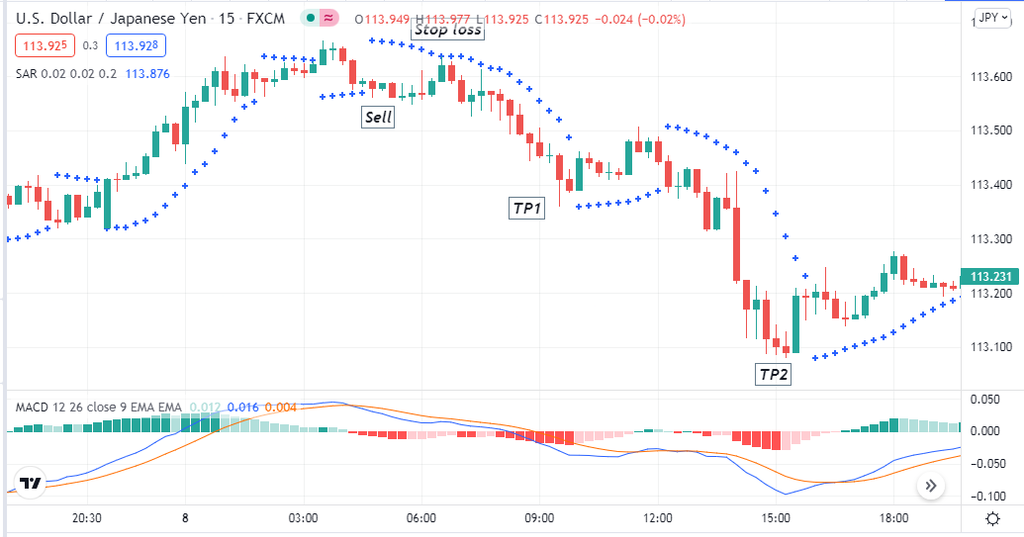
Bearish setup
Entry
When these conditions above match with your target asset chart, place a sell order.
Stop-loss
The initial stop loss level will be above the current swing high.
Take profit
Continue the sell order till the current trend remains intact. Close the sell order when
– The parabolic SAR dot flips below price candles.
-The dynamic blue line crosses the dynamic red line on the upside at the MACD window.
– MACD green histogram bars take place above the central line.
A long-term trading technique
Our long-term trading technique involves the golden cross beside the parabolic SAR indicator. A golden cross occurs between two moving averages, EMA 50 (red) and EMA 200 (blue). When the red EMA crosses the blue EMA line on the upside, it indicates bullish pressure on the asset price and vice versa for when the opposite crossover occurs. This strategy obtains excellent results on the daily chart.
Bullish trade scenario
Seek to place buy orders when
- The parabolic dots take place below price candles.
- The red EMA crosses the blue EMA on the upside.
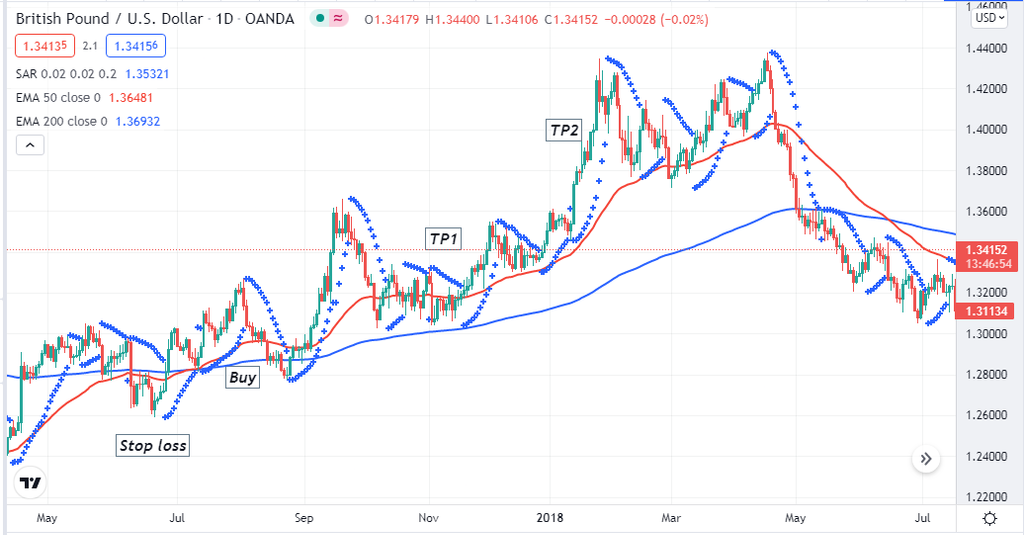
Bullish setup
Entry
When these conditions above match with your target asset chart, place a buy order.
Stop loss
Set an initial stop loss below the current swing low.
Take profit
Close the buy position when
- The parabolic dots take place above price candles.
- The red EMA line crosses the blue EMA on the downside.
Bearish trade scenario
Seek to place sell orders when
- The parabolic dots take place above price candles.
- The red EMA crosses the blue EMA on the downside.
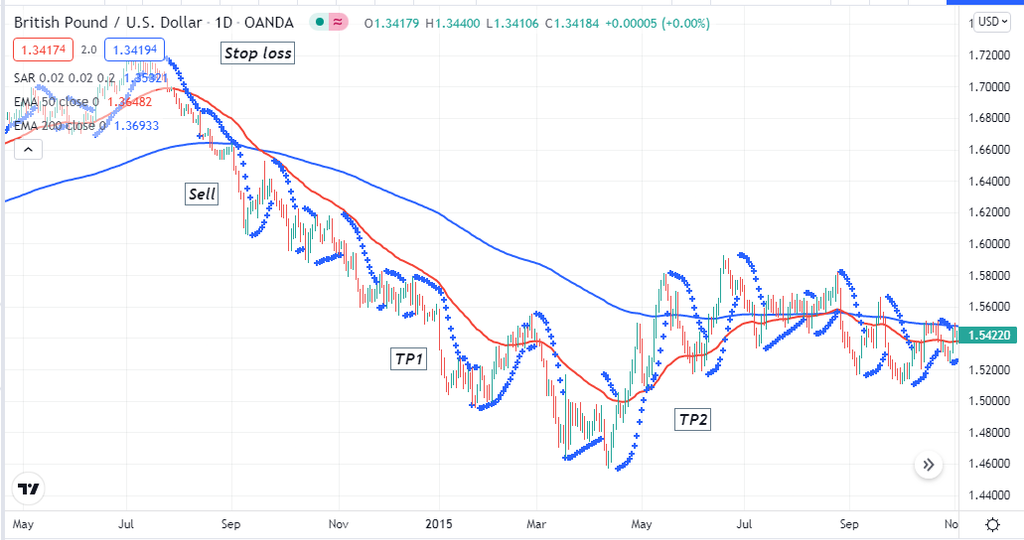
Bearish setup
Entry
When these conditions above match with your target asset chart, place a sell order.
Stop loss
Set an initial stop loss above the current swing high.
Take profit
Close the buy position when
- The parabolic dots take place below price candles.
- The red EMA line crosses the blue EMA on the upside.
Pros and cons
The top three pros using the Parabolic SAR are
- This indicator suggests complete trading positions, including entry/exit.
- Applies to many trading assets.
- Allow making short-term and long-term trading positions.
The top three cons are
- The parabolic SAR suggests best trades on trendy price movement.
- Generates wrong trading positions on consolidating price movement.
- Trading strategies can fail due to fundamental economic news.
Final thought
Finally, the parabolic SAR is a potential trading indicator. You can make thousands of pips using the strategies above we describe. We suggest performing demo trading using these strategies before applying them to real trading and avoiding trades during major fundamental news releases.