
In financial trading, harmonic patterns are becoming popular day by day for its effectiveness and accuracy. Harmonic patterns use Fibonacci retracement calculations and make geometric structures to define the future price movements of the asset. There are two types of harmonic patterns- internal patterns and external. Internal harmonic patterns include Bat and Gartley, and the example of external patterns are Crab and the Butterfly pattern.
In this article, we will discuss the Butterfly pattern, which is an external type harmonic pattern. The following section includes a complete knowledge about the Butterfly pattern, what it is, how to identify, the key facts to check, and trade setups using this pattern.
What is Butterfly Pattern?
The butterfly pattern is a popular harmonic pattern, discovered by Bryce Gilmore and further defined by Scott Carney. It is a harmonic pattern that suggests the reversal type of trade ideas.
This pattern has four legs similar to the Bat, Crab, or Gartley pattern. The structure of the butterfly pattern starts with point X and ends with point D. Idea is simple: follow the legs that will reach a certain price level to identify precious entry positions. Like the crab pattern, it is also a reversal pattern that allows traders to enter at extreme lows or highs. Point D is vital at this pattern because this suggests the entry point or Potential Reversal Zone (PRZ).
How to identify the butterfly pattern?
The butterfly pattern has four legs that connect with five points. Five points start with point X and end with point D. Like the crab pattern; this pattern also ends with the Fibonacci extension level. The difference is that the Crab pattern ends with a 161.8 percent Fibonacci extension level of the first leg XA, where the butterfly pattern ends with a 127 percent Fibonacci extension level of the first leg. In this part, we will specify the legs and points to get an idea of the whole structure.
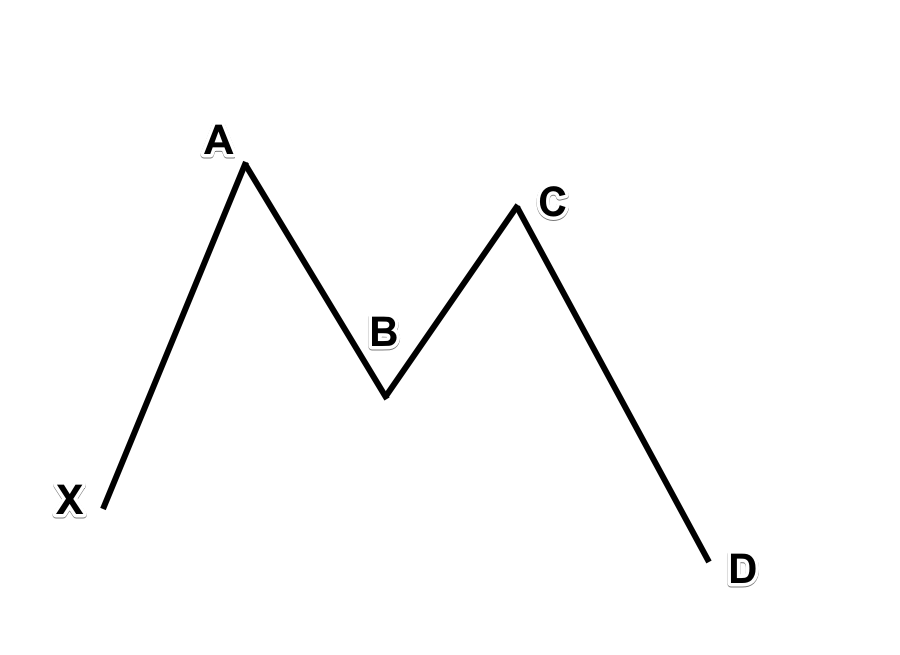
The butterfly pattern consists of four price swings. This pattern becomes like the letter ‘W’ in uptrends and ‘M’ in the downtrends by connecting all five points. Sometimes the butterfly pattern is mistaken with a double top or double bottom pattern. The difference is that the butterfly pattern doesn’t always appear at the end of a trend, although it sometimes does.
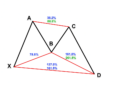
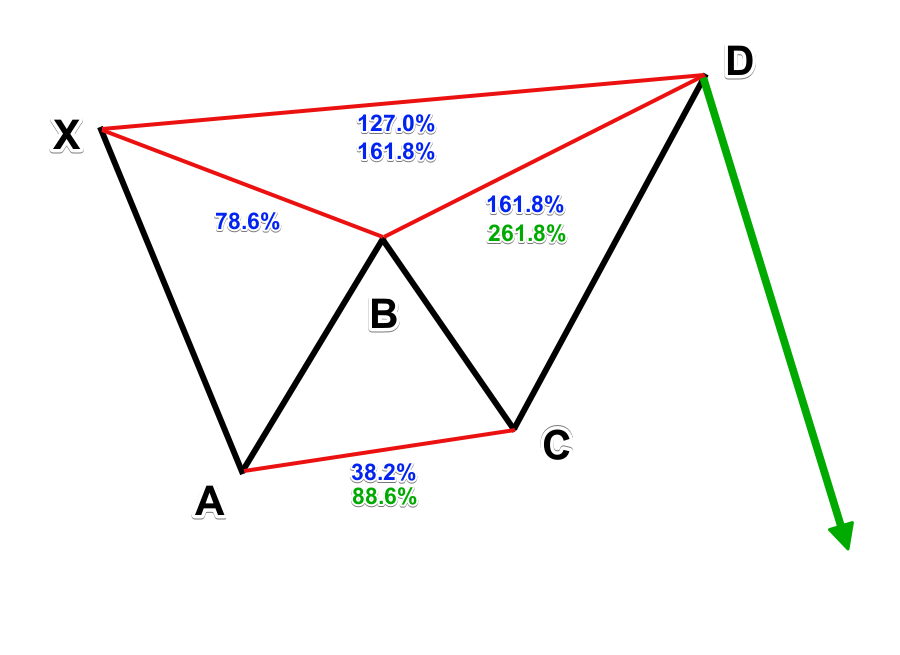
Let’s have a look at a simple illustration of the butterfly pattern:
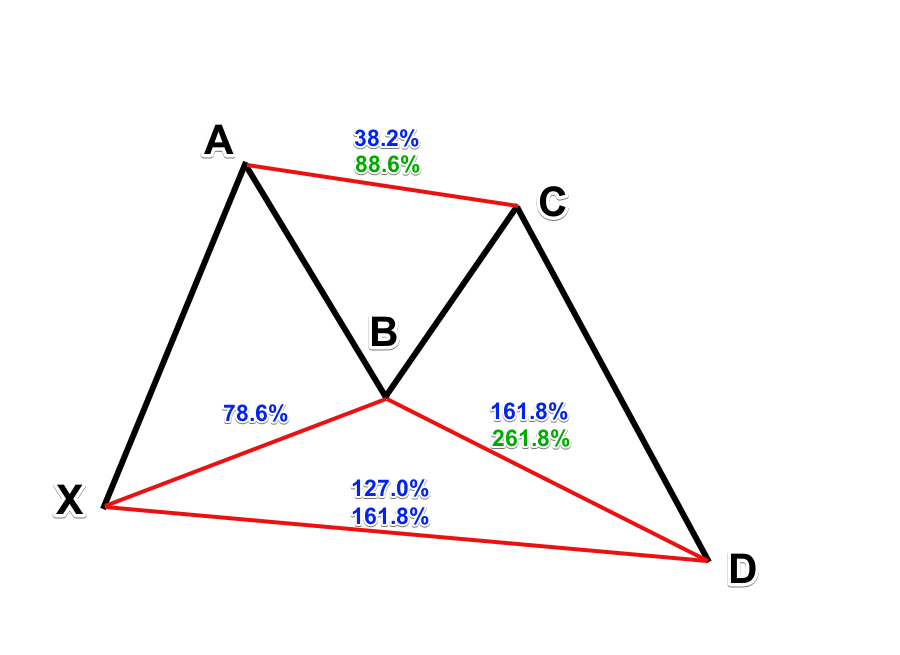
Let’s have a closer look at the Fibonacci relationship within the butterfly structure.
- XA: It is the first leg that forms the whole structure. No specific move is required for this leg. However, it is vital as other portions depend on its Fibonacci calculation.
- AB: The next leg is AB. Point B is a critical point of the whole pattern which should retrace the 78.6% Fibonacci level of the XA leg.
- BC: The next leg BC depends on the Fibonacci retracement level previous leg AB. It should retrace between 38.2% or 88.6% level of the AB move.
- CD: If BC is 38.2% of AB, the CD is likely to reach the 161.8% Fibonacci extension of BC. On the other hand, if BC is 88.6% of AB, the CD is expected to reach the 261.8% extension of BC.
- AD: Lastly, the general AD move consisting of AB, BC, and CD should be either 161.8% or 127.0% of XA.
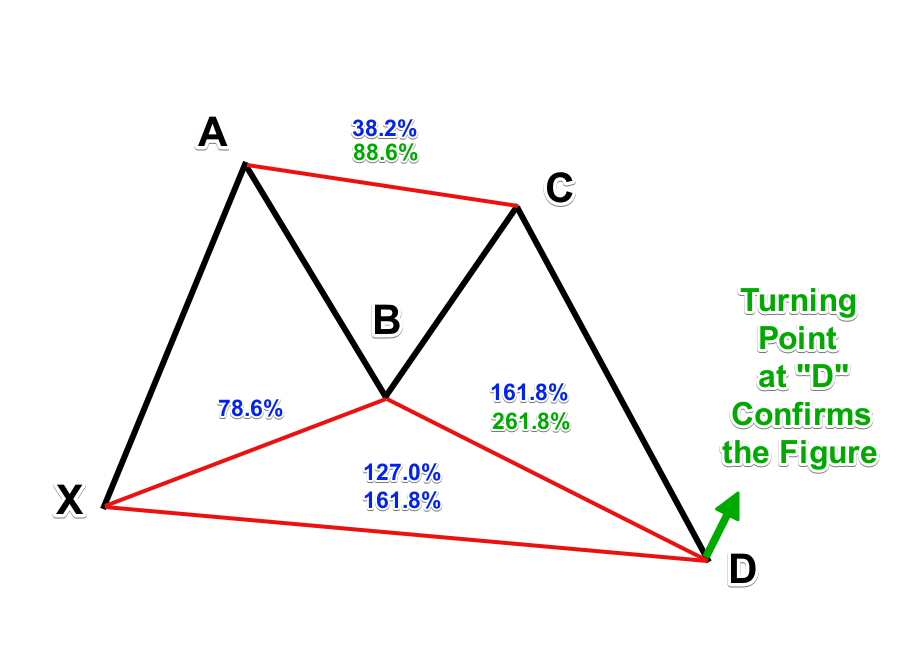
The above is a visualization of the harmonic relationship of the butterfly pattern that shows a possible buying point in the chart.
As discussed above, if BC reaches 38.2% of AB, the CD should go to 161.8% of BC. If BC comes 88.6% of AB, then CD should get 261.8% of BC. It is not an absolute rule but rather a general guideline that you should be aware of.
However, as mentioned earlier, the B point retracement of 78.6% of XA is critical and must be met to classify a butterfly pattern correctly.
Butterfly Pattern: Key Conditions
There are some basic rules or conditions to identify the standard butterfly pattern. These rules are like checklists. Before you place any trade must verify these conditions are proper on your chart. Let’s have a look at the unavoidable rules or key conditions of the butterfly pattern:
- AB is not more than 78.6 percent fibonacci retracement level of XA leg.
- A 127% Fibonacci extension of the X-A leg
- A 161.8% -261.8% Fibonacci extension of the B-C leg.
- BC is a minimum 38.2 percent and maximum 88.6 percent Fibonacci retracement of the second leg AB.
- CD is a target between 1.618 to 2.618 percent Fibonacci extension of AB leg between 1.272 to 1.618 of the first leg XA.
Butterfly Pattern Trading Strategy
Butterfly pattern generates complete trade ideas which include entry, exit, stop loss of any trading entry. This pattern identifies both bullish and bearish trading ideas.
Bullish trading strategy
Entry: Determine the point D that should be at the 127 percent Fibonacci extension of the first leg XA. Place a buy order after the bearish candle forms.
Stop Loss: Place a stop loss below a Fibonacci extension of 161.8 percent of the first leg XA with 5-10 pips buffer.
Take Profit: However, the exit or profit this pattern suggests is dependable with both your trading goal and market condition. For a conservative profit target, the exit or take profit would be at point B, and for an aggressive profit target, it would be near point A. However, the price could reach more above point A if there is any massive force driving the market.
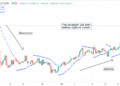
Lets see the practical example of the bullish Bat pattern in the real chart:
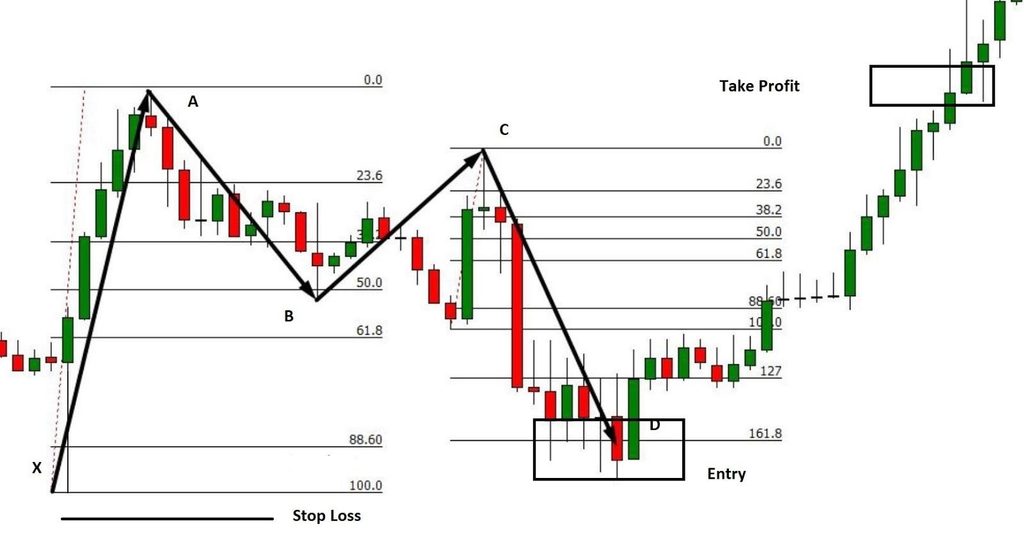
Note: Exit or not, when the price reaches point B after taking entry, it would be wise to shift the entry position at the breakeven point to reduce risk.
Bearish trading strategy
Entry: Determine the point D that should be at the 127 percent Fibonacci extension of the first leg XA. Place a sell order after the bullish candle forms.
Stop Loss: Place a stop loss above a Fibonacci extension of 161.8 percent of the first leg XA with 5-10 pips buffer.
Take Profit: However, the exit or profit this pattern suggests is dependable with both your trading goal and market condition. For a conservative profit target, the exit or take profit would be at point B, and for an aggressive profit target, it would be near point A. However, the price could reach more above point A if there is any massive force driving the market.
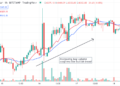
Lets see the practical example of the bullish Bat pattern in the real chart:
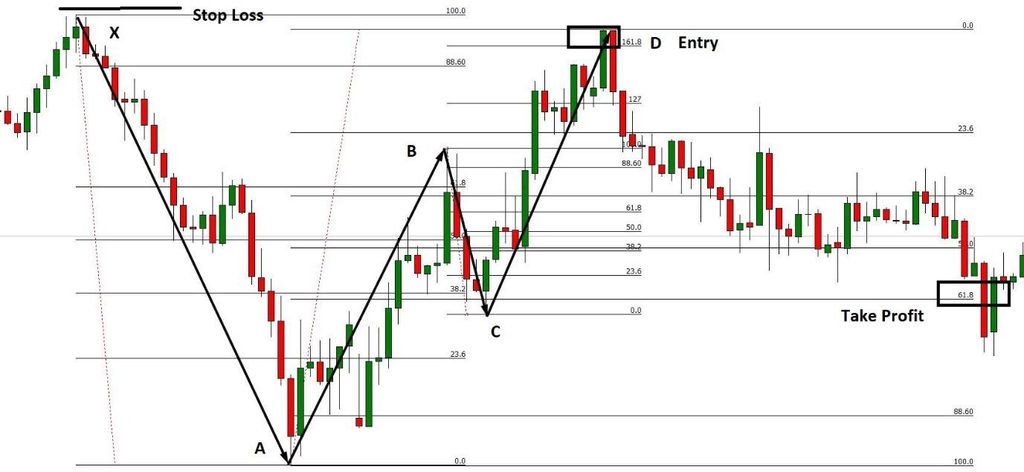
Note: Exit or not, when the price reaches point B after taking entry, it would be wise to shift the entry position at the breakeven point to reduce risk.
Conclusion
No one can underestimate chart patterns as an efficient trading analysis tool. When it comes to indicating a reversal or continuation of the current trend and determining entry and exit positions, they are vital anyway.
Finally, with a proper mind setup and trade management, this harmonic pattern can be legitimate for any beginner or professional trader.