
Crypto volume average cross or crypto VAC indicator is popular among crypto investors as it generates trade ideas by utilizing volume data of underlying assets. Making trade decisions depending on volume info is a typical practice among financial traders as the volume is a significant fact for any financial instrument. So it makes sense that the crypto VAC indicator has become increasingly popular among crypto investors.
However, it is mandatory to know the components and professionals using procedures while deciding to use any technical indicator for successful trading. This article will introduce you to the crypto VAC indicator and the top five tips to execute successful trades using this technical indicator.
What is the crypto VAC indicator?
The crypto volume average cross or crypto VAC indicator is a technical indicator that uses two different volumes and crossovers between them while plotting signals for any trading instrument. This technical indicator uses a slow volume and a fast volume to enable/disable cross signals between these two. When the fast volume value is bigger than the slow volume value, it indicates a bullish pressure on the asset price. Meanwhile, the exact opposite crossover between these volume parameters declares increasing sell pressure on the asset price.
Top five tips for using the volume average cross (VAC) in crypto trading
Now you know what the crypto VAC indicator is, it is time to dive deep into this indicator and discuss pro tips to use this indicator more accurately in crypto trading.
Tip one: When entering a buy trade
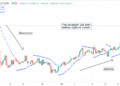
When seeking to open a buy position using the crypto VAC indicator, observe the indicator window as the price finishes a downtrend. Check the dynamic blue line will be above the dynamic green line and green histogram bar declaring buy pressure. Meanwhile, you will see a “long” bubble of green color declaring bullish initiation when the crossover occurs.
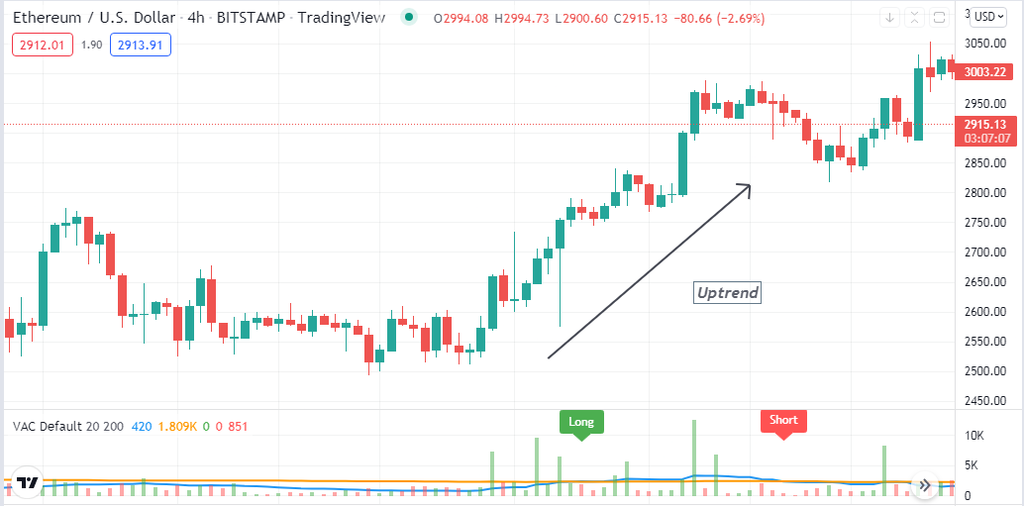
Bullish trend
How does this happen?
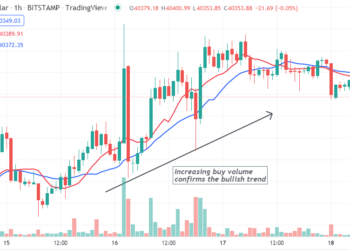
It happens as the fast volume crosses above the slow volume, which means all of a sudden, buyers come to the market and start buying the asset rapidly. Hence, the average buy volume for a shorter period increases, and the price enters a bullish trend.
How to avoid mistakes?
The crypto VAC indicator is an effective technical tool to obtain market context. Use proper stop loss below the current bullish momentum and shift it to the breakeven point or above that level when the price creates a new higher high if they continue their buy order.
Tip two: When entering a sell trade
Observe the indicator window when opening a sell position using the crypto VAC indicator as the price finishes an uptrend. The dynamic blue line will elbow the dynamic green line, and the red histogram bar above these lines declares declining pressure on the asset price. Meanwhile, you will see a “short” bubble of red color declaring bullish initiation when the crossover occurs.
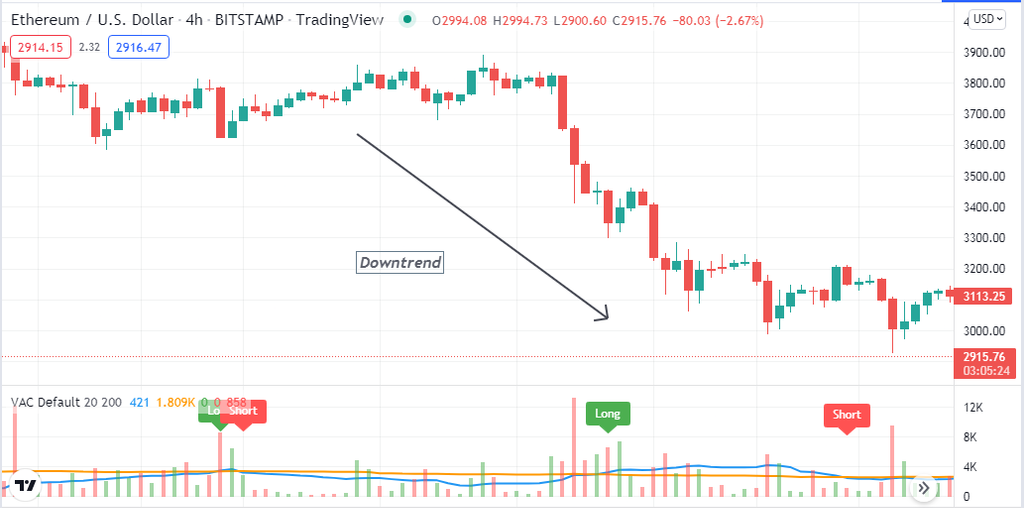
Bearish trend
How does this happen?
Sellers enter the marketplace, sell volume increases, and the fast volume line crosses below the slow volume due to declining pressure.
How to avoid mistakes?
Set a proper stop loss above the bearish momentum and check the readings carefully when making any trade decisions. Moreover, try conducting multi-timeframe analysis to catch more efficient trades.
Tip three: Identity sideways
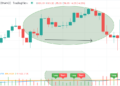
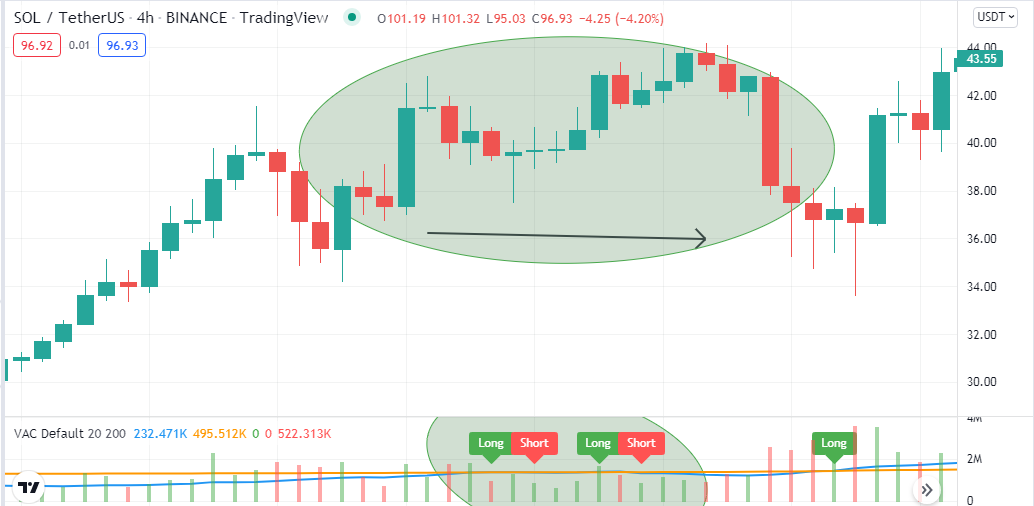
The crypto VAC indicator helps traders determine sideways as it works with volume data. When the window shows a few “long” and “short” bubbles, it declares indecision. Match the volume histogram bars will also be smaller, declaring decreasing volume and sideways or ranging.
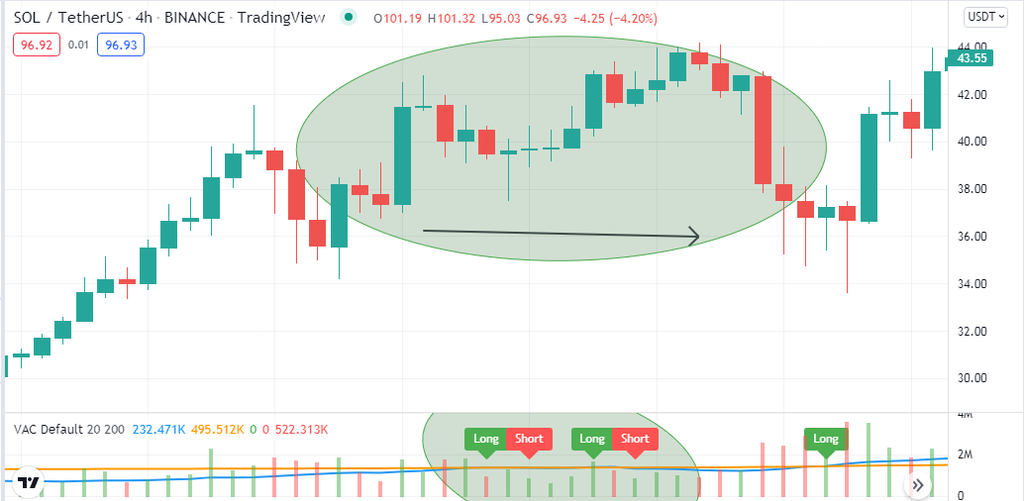
Sideways
Why does this happen?
The price usually moves sideways when the participants lose interest in the asset; no rapid buying or selling occurs, so there is no price direction. It only remains in a range. Frequent long/short bubbles declare transactions in a range.
How to avoid mistakes?
You can enter trades at a ranging market, open buy positions near support levels, and short from the resistance level. It is risky as a breakout can occur at any moment, leading you to a significant loss. Moreover, the profit ratio is usually low in ranging markets.
Tip four: Using Parabolic SAR with crypto VAC indicator
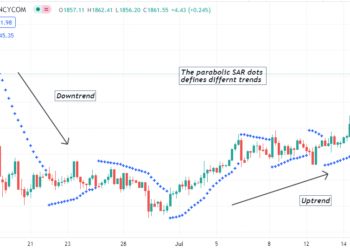
Crypto investors often use other supportive indicators alongside the VAC indicator to determine efficient trading positions. You can use the Parabolic SAR to identify swing points and combine the reading with the crypto VAC indicator to get a complete trade setup. For example, crypto VAC Suggests a buy trade, and the Parabolic SAR makes a series of dots on the bottom side of price candles. The exact opposite scenario on these indicators suggests opening sell positions.
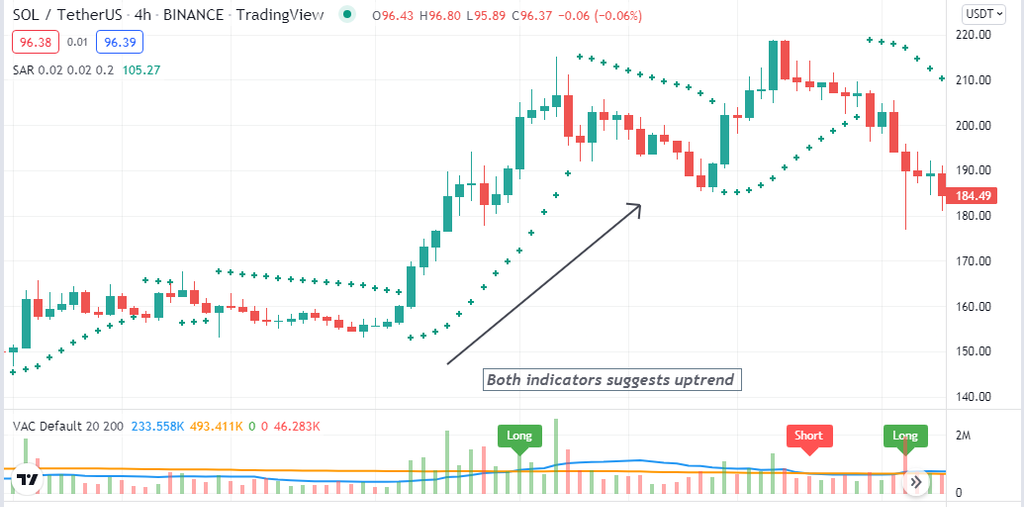
Combining parabolic SAR and VAC indicator
Why does this happen?
Both technical indicators are popular tools for crypto investors. When someone can combine the readings properly, it enables determining more accurate entry/exit positions for trades.
How to avoid mistakes?
Combine the readings while entering any trade and use proper stop loss for existing trades.
Tip five: Determine breakouts by combining Bollinger bands
When the price enters a consolidating phase or sideways, the bands of BB get closer. Any breakout occurs, so the band gets wider. You can use this concept and combine it with the crypto VAC indicator to catch swing trades. For example, the crypto VAC indicator may show a “long” bubble, and the bands of the BB indicator start to wide on the upper side. Both readings suggest the price may enter a bullish trend, suggesting opening a buy position.
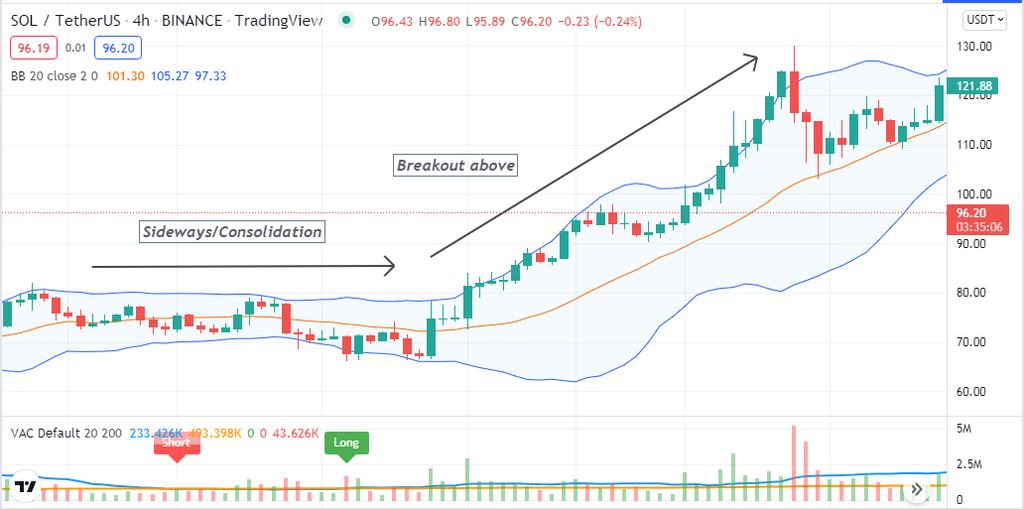
Determining breakout
How does this happen?
The BB indicator is popular among financial traders to determine breakout levels. We combine the concept with a crypto VAC indicator to execute more potent trades.
How to avoid mistakes?
Don’t make early entries; match indicator readings carefully before entering trades. We suggest conducting a multi-timeframe analysis while seeking short-term trading positions to confirm the price direction.
Final thought
Finally, the Crypto VAC indicator generates trade ideas by calculating the raw parameters of the asset price. This concept enables executing constantly profitable trades once you master the concept. Moreover, you can combine other technical tools and indicators, including support resistance, Fibonacci retracement, MA crossover, RSI, MACD, etc., to create more efficient crypto trading strategies.