
Bitcoin, the original cryptocurrency, is the most valuable coin in the crypto industry. Many investors have already made millions of dollars from this coin as the price surged to nearly $69k per coin, at an all-time high last year. So it makes sense that the crypto market has become a more attractive place to make money.
However, successful crypto investors always follow specific guidelines when making trade decisions so that they can perform more profitable trades and reduce risks one trades. This article lists the top five tips to buy and sell Bitcoin using technical indicators.
Bitcoin Buy & Sell Indicator Strategy?
There are many technical indicator to find the buy or sell momentum of bitcoin like moving average, bollinger bands, RSI, stochastic, etc. However, the popular way to bitcoin buy & sell is using the moving average; when the lower valued MA crosses the higher value, it creates a trend.
A crossover is a popular technical concept among financial traders while making trade decisions. This concept suits nearly any financial instrument. This concept contains two or more moving averages to obtain the market info and make trade decisions. In this case, an MA line of a shorter parameter crosses above or below another MA line of the more extended parameter to generate trade ideas.
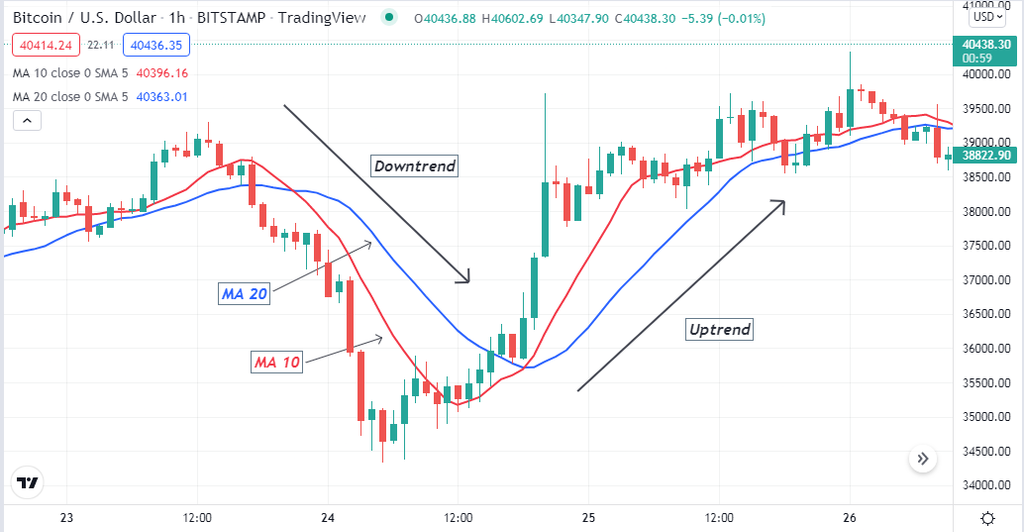
Different trends by MA crossover
When the shorter MA crosses above the longer periods MA, it indicates buyers dominate the market, and the exact opposite crossover between these MA lines declares bearish momentum. Bitcoin investors frequently rely on this concept to catch consistently profitable trading positions.
However, among other bitcoin buy sell indicator you can use RSI as an Oscillator and Bollinger Bands. Let’s see how Bollinger Bands and RSI works together:
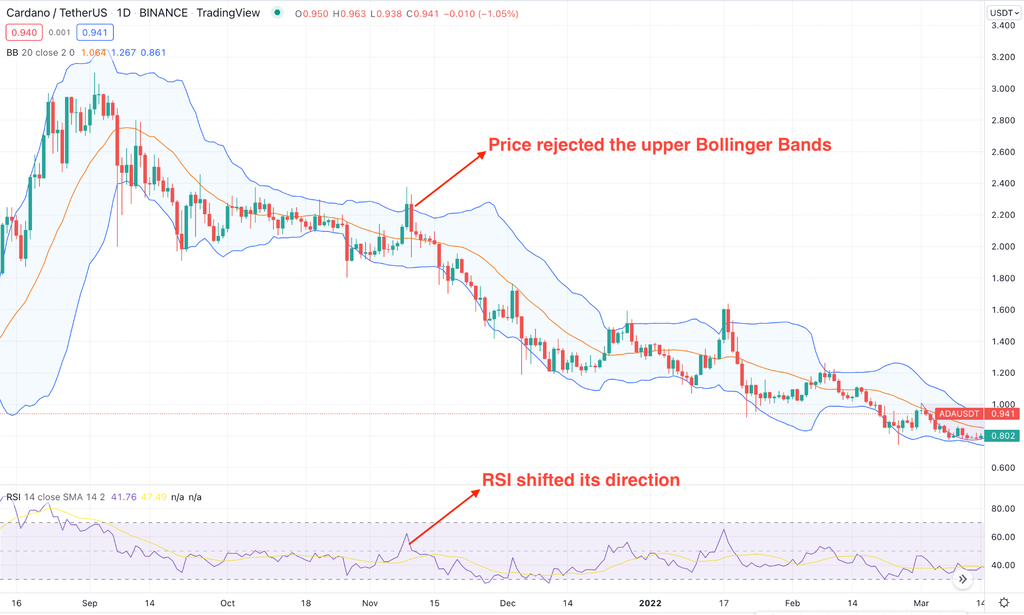
Bitcoin buy & sell using Bollinger Bands
Top five buy/sell Bitcoin tips
Now you know the concept of using indicators to predict the Bitcoin price. Now, we will move to the core part where we will see how traders should remain cautious about buying or selling Bitcoin using an indicator. For this example, we have used MA crossover concept but this precautions are applicable to any indicator based trading.
Tip one: When entering a buy trade
When seeking to enter a buy position, observe trading conditions carefully. For instance, look at the chart below; the price reaches above the red MA and then the blue MA as buyers take control. The red MA line surpasses the blue MA line on the upside, declaring the initiation of the bullish momentum.
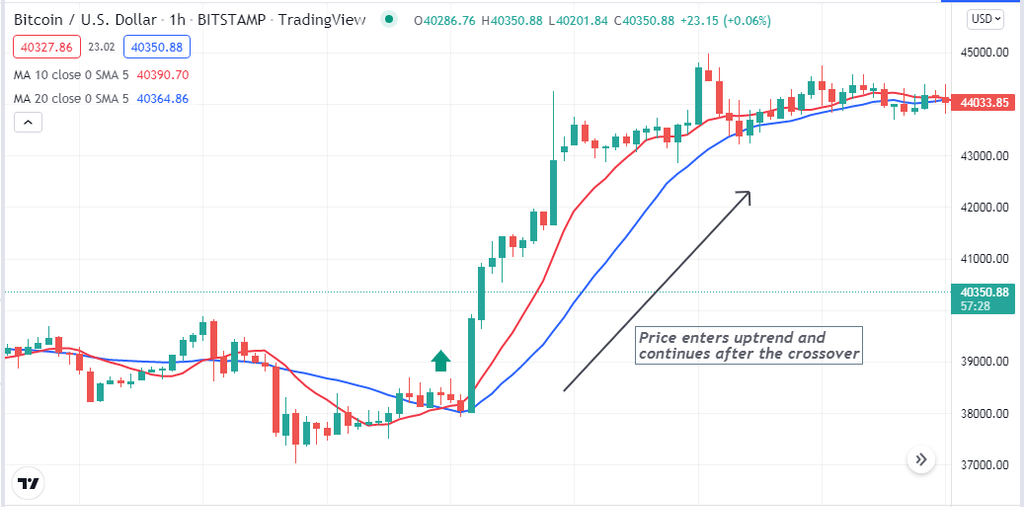
Bullish trend
How does this happen?
MA indicators calculate the market data for each candle and make an average of prices. The shorter MA gets above the other MA of a longer period means short-term volatility of buying pressure increases.
How to avoid mistakes?
Traders often make early entries before the trend begins. In that case, only enter after a valid crossover. Suppose you are a short-term trader, conduct a multi-timeframe analysis before entering any trade by checking on upper timeframe charts. It will give you an idea of the actual trend and price direction. Additionally, place a stop loss below the current bullish momentum to reduce risk.
Tip two: When it is a bearish momentum
When seeking to enter the sell trade, this crossover concept helps enter the appropriate position. First, the price will decline below the red MA and then the blue MA. The red MA will cross below the blue MA declaring the initiation of bearish momentum.
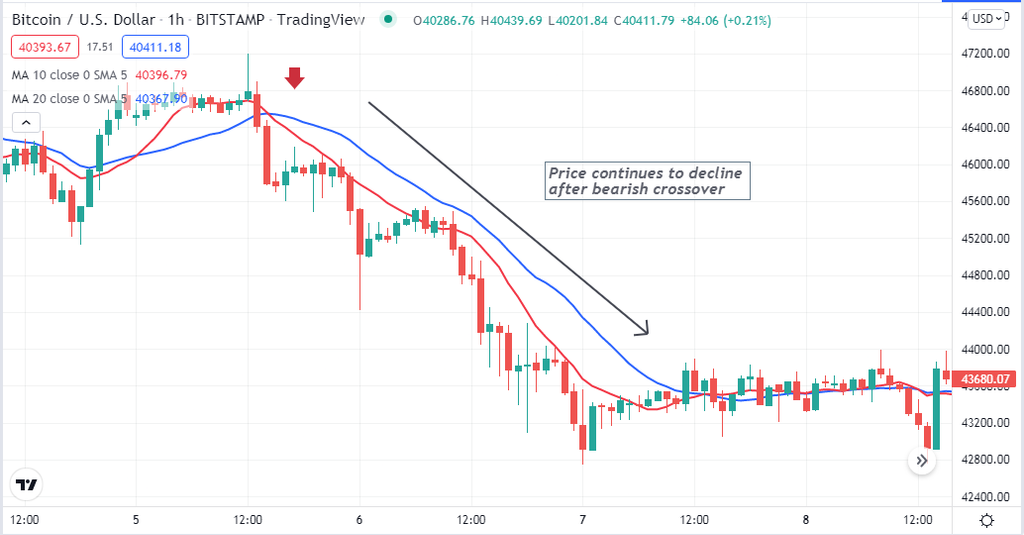
Bearish trend
How does this happen?
The average price of shorter-term is declining fast means sellers are entering the market. So it makes sense that the shorter MA gets below the MA of the longer period means increasing selling pressure.
How to avoid mistakes?
Enter trades only after a valid crossover; check the upper timeframe charts to confirm the price direction. Additionally, place an initial stop loss just above the bearish momentum when entering any sell trade as a part of risk management.
Tip three: Identifying sideways
This MA concept helps investors to determine sideways. When the MA lines frequently cross each other, it causes confusion among participants. Identifying sideways is important as it indicates an upcoming breakout or indecision.
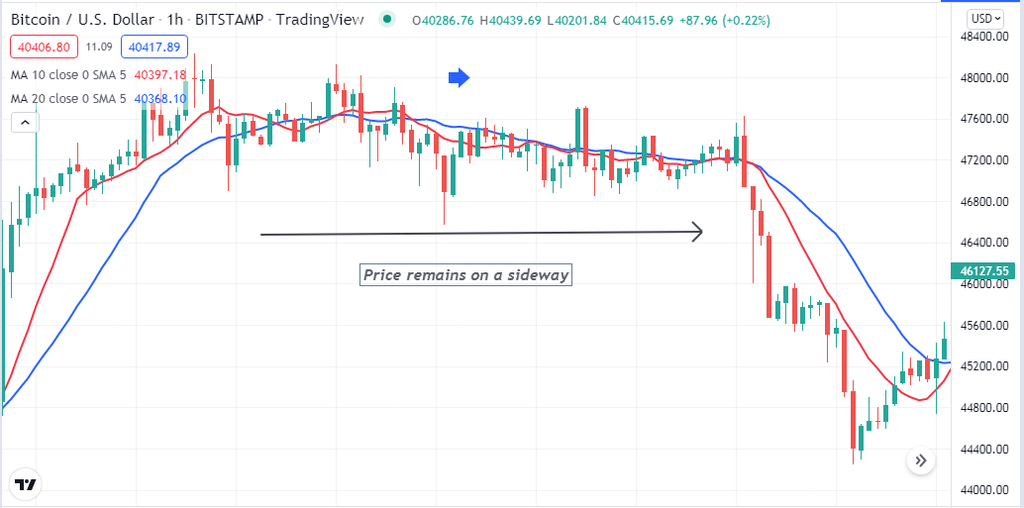
Sideways
Why does it happen?
Price usually enters a sideway when volatility decreases. The MA lines cross and declare long-term, and the short-term average price reaches a range.
How to avoid mistakes?
Determining the sideway or consolidating phase is important as most successful traders don’t enter a new trade in this condition but rather wait for a valid breakout. It enables participating in swing trades and makes considerable profits from the marketplace.
Tip four: Combining volume data
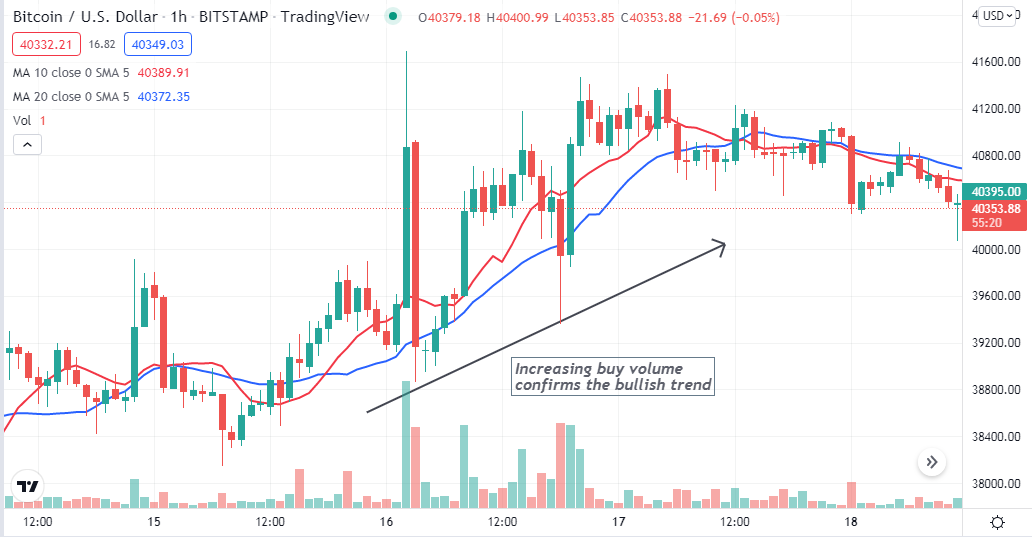
Before entering trades, many crypto investors use the volume indicator alongside the MA crossover concept to confirm the price direction. For example, a bullish crossover occurs, checking the volume indicator; it declares increasing buy pressure by green histogram bars and a potential uptrend.
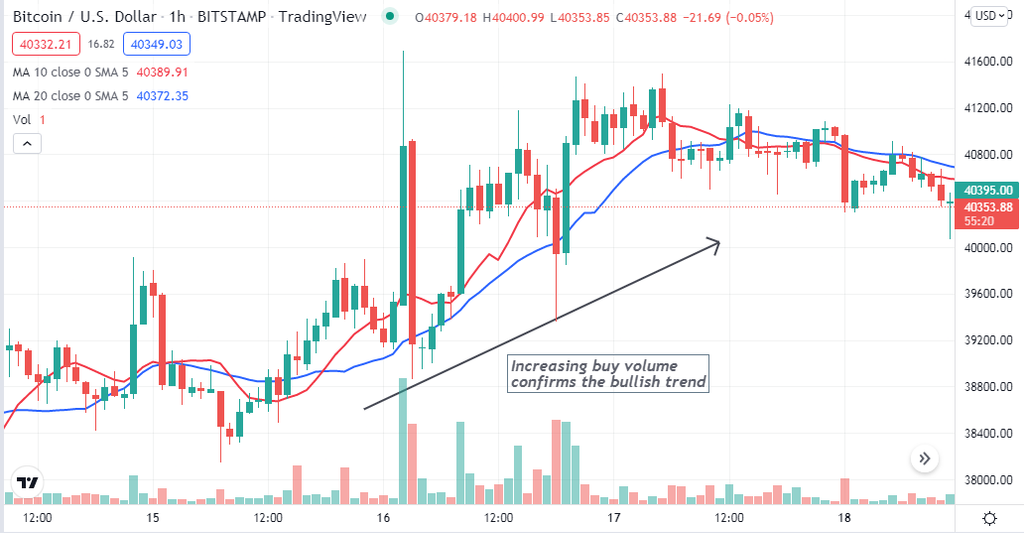
MA crossover and volume indicator
How does this happen?
You already know the MA crossover concept, and the volume indicator shows buyer/sellers domination by histogram bars. When declining pressure increases, it creates red histogram bars.
How to avoid mistakes?
Combine the readings from indicators and match them properly before entering any trade. Don’t forget to use stop loss for any existing trade. The volume indicator constantly makes histogram bars according to participants’ actions. Moreover, when the histogram bears get smaller and declare low volatility, avoid entering trades in those conditions as it signals sideways or ranging markets.
Tip five: Using relative strength index
Crypto investors often use another popular momentum indicator, the RSI, as a supportive tool alongside the MA crossover concept to generate trade ideas. For example, check the RSI indicator window when the price may decline, and a bearish crossover occurs between the MA lines. Match the RSI dynamic line near the central line and starts sloping on the downside; it declares a fresh bearish momentum initiates. The exact opposite scenario will declare a potential bullish momentum.
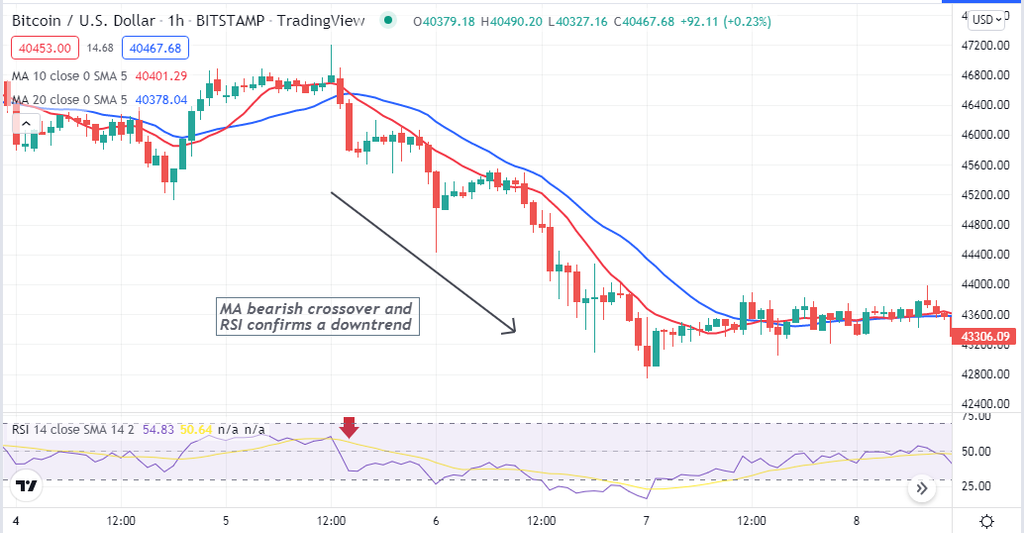
MA crossover and RSI indicator
Why does this happen?
The crossover concept and the RSI indicator are powerful technical tools in the financial market. Combining these indicators readings enable making successful trade entries.
How to avoid mistakes?
It is mandatory to check and match readings carefully before entering any trade. Short-term traders should check on upper timeframe charts and conduct multi-timeframe analyses to generate more effective trade ideas. Moreover, use proper stop loss for any trade and never forget that the 2% rule suggests not risking more than 2% of your capital for open trades.
Final thought
Finally, when using this MA concept, you can make consistently profitable trades, and this concept suits fine nearly any trading instrument, including forex, commodities, stocks, other cryptocurrencies, etc., alongside BTC. However, crypto assets are volatile, don’t risk as much as you can’t afford.