
The Trend Analysis Trading System For MT4 is a trend trading method based on 4 custom indicators. This strategy aims to remove the market noise by using higher timeframes, 4 hours, or daily. Therefore, if you want to build a position or swing based trading method, you can use this strategy as a perfect option. After completing this article, you will know how to make a profitable trade in any situation with this strategy.
The Trend Analysis Trading System For MT4
Like other trends following systems, we will follow the current market trend from where the price may show minimum risk and maximum reward.
At first, we should see the trading indicators of this strategy:
- Trend Analysis 1
- Trend Analysis 2
- Trend Entry 1
- Trend Entry 2
If we plot these indicators in the chart, it will be like this:
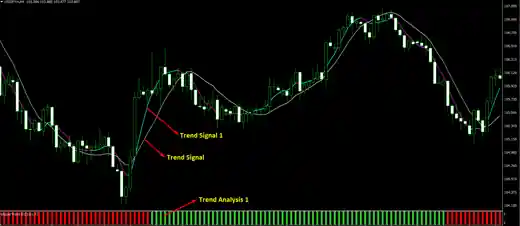
In the following section, we will see this strategy’s details in both the bullish and bearish market.
Bullish Trend Analysis Trading System
The bullish trading strategy is based on multiple trading confirmations with indicators in this strategy. The best benefit of this strategy is that there are no limitations on the trading instruments. There are enormous trading assets in the forex market, and you can choose any currency pair that matches your personality.
However, sticking to the major currency pairs will decrease the trading cost. So it is better to avoid trading in exotic pairs.
The timeframe used in this strategy is 4H and Daily. So that if you want to build a swing trading or position trading idea, you can choose this system.
Conditions
There are multiple indicators in this strategy, and if you want to take an entry, you should match the same trend direction in all indicators. Before taking an entry, make sure to match all indicators:
- Trend Analysis 1 indicator shows the buy signal by appearing in Green color.
- Trend Analysis 2 indicator shows the buy signal by appearing in Green color.
- Trend Entry 1 shows a buy signal by allowing the price to move above it.
- Trend Entry 2 also shows the buy signal by allowing the price to move above it.
Entry Rules
When the price moves above the Trend Entry 1 and trend Entry 2 line, wait for a bullish candle to close. After that, open the buy trade if you see the price to close above the previous candle’s high.
Make sure to follow appropriate money management rules in every trade.
Stop-Loss Rules
The bullish momentum may extend as long as the price is above the Trend Entry 1 and trend Entry 2 line. Therefore, set the stop loss below the trend entry 2 lines with some buffer.
Take Profit Rules
You can extend the take profit level beyond the stop loss level if you see that the price is allowing you. Moreover, you should consider the near term event levels to get a better take profit level.
Example Of A Buy Trade
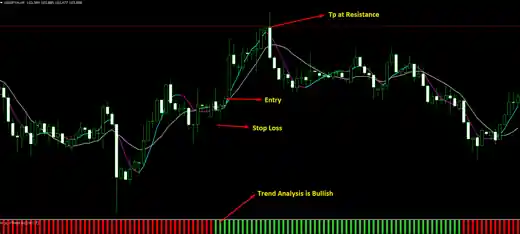
- The image above is the USDJPY H4 chart, where the price tried to move below the Trend Signal 1 and trend Signal 2 Indicator but failed to gain a bearish momentum.
- As a result, the price moved higher towards these levels and made a candle close.
- In the meantime, the trend Analysis indicator shows a bullish signal by changing the color from Red to green.
- As a result, the price moved higher straight to the near term resistance level and made a bearish movement.
Bearish Trend Analysis Trading System
The bearish trading strategy is based on multiple trading confirmations with indicators in this strategy.
There are enormous trading assets in the forex market, and you can choose any currency pair that matches your personality. However, sticking to the major currency pairs will decrease the trading cost.
The timeframe used in this strategy is 4H and Daily. So that if you want to build a swing trading or position trading idea, you can choose this system.
Conditions
There are multiple indicators in this strategy, and if you want to take an entry, you should match the bearish trend direction in all indicators. Before taking an entry, make sure to match all indicators:
- Trend Analysis 1 indicator shows a sell signal by appearing in Red color.
- Trend Analysis 2 indicator shows a sell signal by appearing in Red color.
- Trend Entry 1 shows a Sell signal by allowing the price to move below it.
- Trend Entry 2 also shows the Sell signal by allowing the price to move below it.
Entry Rules
When the price moves below the Trend Entry 1 and trend Entry 2 line, wait for a bearish candle to close. After that, open the sell trade if you see the price to close below the previous candle’s low.
Make sure to follow appropriate money management rules in every trade.
Stop-Loss Rules
The bearish momentum may extend as long as the price is below the Trend Entry 1 and trend Entry 2 line. Therefore, set the stop loss above the trend entry 2 lines with some buffer.
Take Profit Rules
You can extend the take profit level beyond the stop loss level if you see that the price is allowing you. Moreover, you should consider the near term event levels to get a better take profit level.
Example Of A Sell Trade
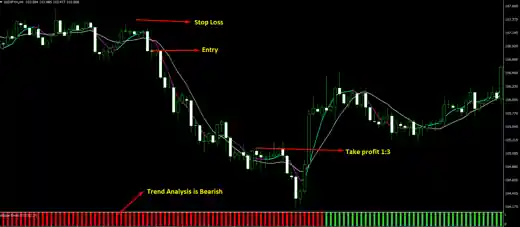
- The image above is the USDJPY H4 chart, where the price consolidates at the Trend Signal 1 and trend Signal 2 Indicator. Later on, the price made a strong bearish candle close below it
- In the meantime, the trend Analysis indicator shows a bearish signal by changing the color from Green to Red.
- As a result, the price moved lower straight to the near term support level with a 1:3 R: R.
Summary
Let’s summarise The Trend Analysis Trading System For MT4:
- The Trend Analysis Trading System For MT4 is a trend trading method based on 4 custom indicators.
- The best benefit of this strategy is that there are no limitations on the trading instruments.
- The trading entry comes from Trend Signal 1, 2, and trend analysis.
Overall, this strategy may provide a decent profit in every market if you can follow trading rules perfectly.