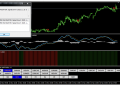

The TG Strategy Trading System For MT4 is a trend following strategy that identifies trends and market shifting points to generate trade ideas. This is a straightforward trading method adopted by any trader with some basic knowledge about forex trading.
The TG Strategy Trading System For MT4
It’s a trend following strategy based on some custom made technical tools/indicators that suggest the most accurate trading positions by calculating market information related to trend and volatility.
List of tools/indicators
- FT3
- TG
- TR2
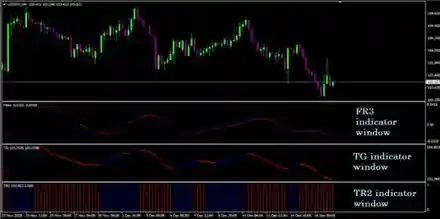
Introduction To Tools
FT3 is a unique indicator with two different (blue and red) colored signal lines at an independent window. When the market price starts to move upside, or a bullish pressure comes, the blue signal line of this window crosses above the red line and when the market begins to turn bearish red signal line crosses above the blue line.
The TG indicator contains two signal lines at an independent window, and both of them change colors with the trend of price movement changes at the main window. Both of them signal lines become blue and heading towards the upside for a bullish price trend of the asset, and when both of them become red and heading toward the downside, that is a declaration of a downtrend asset price.
The TR2 has an independent indicator window that contains different (blue and red) colored bars for another type of price movement. Bars are red at this indicator window when asset price moves downward, and if the price moves, higher bars become blue.
Bullish trading strategy
It is an easily applicable trading system that works fine on every kind of currency (major or cross) pairs, and the recommended time frame for this strategy is daily (1D) and the 4-hours chart. First, check the buy conditions or scenario below before placing any buy order.
Bullish Trading Conditions
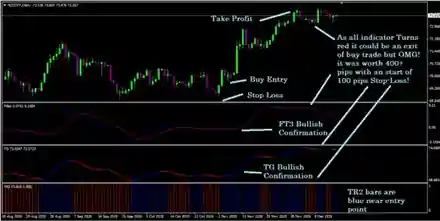
- The Blue line crosses above the red line at the FT3 indicator window.
- The signal lines of the TG indicator are blue and heading towards the upside.
- Check the TR2 indicator window bars are blue.
Entry
When all the buy conditions above are correct for the target asset, it’s indicating the downtrend may be over for the asset and the price entering a bullish or uptrend phase. Check all the conditions, verify the entry direction matches with the upper time frame chart, wait until the current candle closes, and then place a buy order.
Note: Don’t be in a rush for placing orders; if you are late for an entry or missed a trade, it’s ok; you will get another chance but don’t enter a trade with low probability.
Stop loss
Place an initial stop position below the recent swing low. This trading method suggests a stop loss value of 100 – 120 pips for the daily chart and 50-70 pips for the 4-hour chart (not more than that).
Note: To reduce risk, stop loss could be shifted at or above the breakeven point after price creates the first higher.
Take Profit
Generally, this method suggests trade ideas about 1:1 or 1:2 risk rewards (take profit equals the stop-loss or two times of the stop-loss value). Don’t continue the buy order or close all buy order if:
- The red line crosses above the blue line at the FT3 indicator window.
- Signal lines of the TG indicator become red.
- TR2 indicator window showing red bars.
Note: Close buy order if any two of the three indicators show a reversal signal. As a trend following strategy, small retracements at lower time frames can be ignored, and holding positions are safe as long as the trend remains intact.
Bearish trading strategy
It is an easily applicable trading system that works fine on every kind of currency (major or cross) pairs, and the recommended time frame for this strategy are daily (1D) and the 4-hours chart. First, check the sell conditions or scenario below before placing any sell order.
Bearish Trading Conditions
- The red line crosses above the blue line at the FT3 indicator window.
- The signal lines of the TG indicator are red and heading towards the downside.
- Check the TR2 indicator window bars are red.
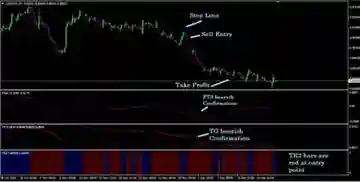
Entry
When all the sell conditions above are correct for the target asset, it’s indicating the uptrend may be over for the asset and the price entering a bearish or downtrend phase. Check all the conditions, verify the entry direction matches with the upper time frame chart, wait until the current candle closes, and then place a sell order.
Note: Don’t be in a rush for placing orders; if you are late for an entry or missed a trade, it’s ok; you will get another chance but don’t enter a trade with low probability.
Stop loss
Place an initial stop position above the recent swing high. This trading method suggests a stop loss value of 100 – 120 pips for the daily chart and 50-70 pips for the 4-hour chart (not more than that).
Note: To reduce risk, stop loss could be shifted at or below the breakeven point after price creates the first lower low.
Take Profit
Generally, this method suggests trade ideas about 1:1 or 1:2 risk rewards (take profit equals the stop-loss or two times of the stop-loss value). Don’t continue the buy order or close all sell order if:
- The blue line crosses above the red line at the FT3 indicator window.
- Signal lines of the TG indicator become blue.
- TR2 indicator window showing blue bars.
Notes: Close sell order if any two indicators show a reversal signal. As a trend following strategy, small retracements at lower time frames can be ignored, and holding positions are safe as long as the trend remains intact.
Conclusion
It’s a straightforward trading system as when the indicators are blue, that’s a bullish scenario for the asset, and indicators become red at bearish price movement. By following some necessary trade and money management, this trading system’s constant profit can be made; avoid trading with this strategy during major fundamental trend changing economic events of related currency pairs (to avoid risk or sake of safe trading).