
The My Win System Trading System For MT4 is a complex trading strategy that uses a lot of trading indicators that will help traders to make better trading decisions. If you follow the trading rules, you can achieve a guaranteed profit in every set of trade. However, you should make sure to follow the rules and implement them at the right time. If you are enthusiastic about forex trading, you can proceed to the next section where we will see details of this strategy with a practical example.
The My Win System Trading System For MT4
This trading system is very profitable when the price is moving within a trend. Therefore, identifying a trending environment is the first condition to achieve the ultimate trading goal. Let’s see the list of trading indicators for this strategy:
- Moving Average (MA)- value 169
- XBD 4
Now, we will see the trading chart with these indicators:
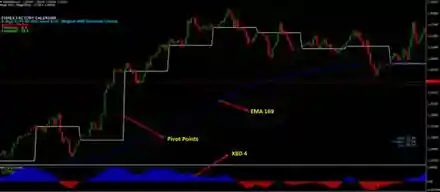
Bullish Trading System
The main aim of this strategy is to focus on trades with a higher probability. Therefore, it applies to some currency pairs only. However, if you wish you can apply this system on other trading assets, but it is better to stick to the following currency pairs.
- EURUSD
- AUDUSD
- GBPUSD
- USDCHF
- GBPGPY
- EURJPY
- AUDJPY,
- GBPCHF
- NZDUSD,
Coming to the trading timeframe, this strategy is designed for an intraday or swing trading idea. So it is applicable on H1 timeframes only. Therefore, the trading result on other timeframes is not tested.
Conditions
- The price is above MA 169, or the price rejected the MA 169 and started to move higher.
- There is no high impact news in this candle or the next candle.
- XBD4 is bullish and appeared in Blue colour. The Blue colour represents a bullish scenario where the price may move higher if the blue Histogram makes a new high.
Entry
When the price corrects lower, the XBD4 will be bearish and shown in Red colour. After that, you should wait for the colour to change from Red to Blue. Changing the colour and the price is likely to start the bullish trend. After that, a bullish candle should appear and take the trade when a bullish candle and Blue histogram is seen in the chart.
Stop Loss
If the price is above the MA 169, the overall price context is expected to remain bullish. Therefore, set the stop loss at 80 pips.
Later on, if the price starts to move higher, you should minimize the stop loss by watching the MA and Fibo level.
At first, put the stop loss to MA 169 and minimize it by following appropriate Fibo levels.
Take Profit
The first, take profit is based on 1:1 R: R, that is 80 pips. However, you can extend or minimize the take profit level by watching the market condition and speed.
Example of A Buy Trade
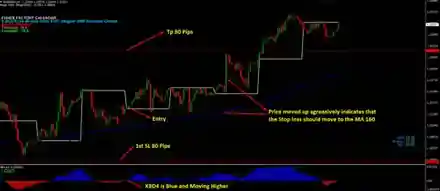
- Here, we are watching the EURUSD h1 chart, where the price is moving higher from left to right.
- The entry became valid at 1.2130 when the XBD4 colour changes from Red to Blue and a bullish green candle appeared in the chart.
- Later on, the stop loss and take profit level was set at a fixed 80 pips direction at 1.2050 and 1.1123.
- After that, the price started to move higher but failed to make a new high but after a moment the price successfully breakout from the level and the stop loss was moved to the MA 169, which is nearly the entry area.
- Lastly, the price made some correction but ultimately reached the destination of the take profit.
Bearish Trading System
The main aim of the bearish trading strategy is to focus on trades with a higher probability. Therefore, it applies to some currency pairs only as listed below:
- EURUSD
- AUDUSD
- GBPUSD
- USDCHF
- GBPGPY
- EURJPY
- AUDJPY,
- GBPCHF
- NZDUSD,
This strategy is designed for an intraday or swing trading idea. So it is applicable on H1 timeframes only.
Conditions
- The price is below MA 169, or the price rejected the MA 169 and started to move lower.
- There is no high impact news in this candle or the next candle.
- XBD4 is bearish and appeared in Red colour. The Red colour represents a bearish scenario where the price may move lower if the blue Histogram makes a new low.
Entry
When the price corrects higher, the XBD4 will be bullish and shown in Blue colour. After that, you should wait for the colour to change from Blue to Red. Changing the colour and the price is likely to start the bearish trend. After that, wait for a bearish candle and enter the trade when a bearish candle and Red histogram is seen in the chart.
Stop Loss
If the price is below the MA 169, the overall price context is expected to remain bearish. Therefore, the first stop loss should be 80 pips.
Later on, if the price starts to move lower, you should minimize the stop loss by watching the MA and Fibo level.
At first, put the stop loss to MA 169 and minimize it by following appropriate Fibo levels.
Take Profit
The first, take profit is based on 1:1 R: R, that is 80 pips. However, you can extend or minimize the take profit level by watching the market condition and speed.
Example of A Sell Trade
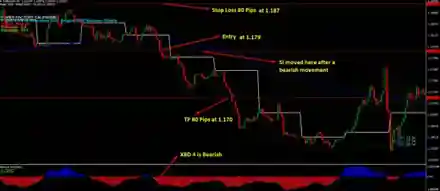
- Here, we are watching the EURUSD h1 chart, where the price is moving lower.
- The entry became valid at 1.1790 when the XBD4 colour changes from Blue to Red.
- Later on, the stop loss and take profit level was set at a fixed 80 pips.
- After that, the price started to move lower, and the stop loss was moved at the EMA 169 level that makes the trade risk free.
- Lastly, the price made a sharp movement downside and reached the final take profit level of 80 pips from where the entry point.
Summary
Let’s see the summary of The My Win System Trading System For MT4:
- This trading system focuses on the major trend continuation.
- If the XBD4 is Blue, the trend is bullish, and if the XBD4 is Red, the trend is bearish.
- This trading strategy uses 1:1 R: R of 80 pips in H1 timeframe.
Overall, this trading strategy has all qualities of an ideal trading system. Therefore, focus on trending environment before making trading decisions and get the ultimate trading result.