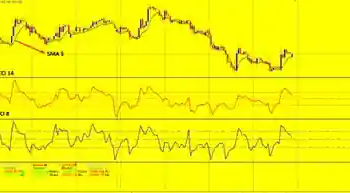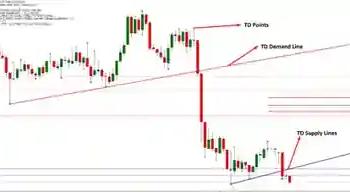

The J9D Trading System For MT4 is a trading strategy that follows a systematic approach to include price action and technical analysis together with high probable trade setups. In this trading method, we will use some mostly used trading indicators like the RSI and Stochastic Oscillator with custom MT4 Stop Level Reversed indicator.
In this following section, we will discuss the complete trading system with a live example.
The J9D Trading System For MT4
Let’s have a look at trading tools used in this trading strategy:
- Exponential Moving Average (EMA)- value 20
- MT4 Stop Level Reversed
- Stochastic Oscillator
- Relative Strength Index
If you implement these indicators, you would see it like this:
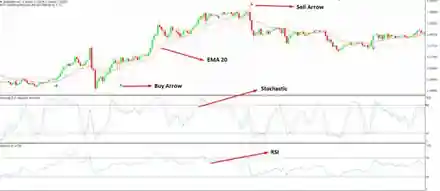
In the following section, we will see the details of the strategy
Bullish J9D Trading System
The bullish trading system is based on multi-timeframe analysis that is very logical and practical in the forex market. At first, we will get an overview of the price in the H4 timeframe and match the price direction in the H1 timeframe using the trend line breakout rules.
On the other hand, there are no limitations on currency pairs. Therefore, you can apply this trading methodology in any pairs from EURUSD to exotics. However, you should focus on trading pairs that have low risks (usually major, minor and cross pairs).
Overall, the bullish trading strategy includes conditions that should meet at a price and the exact entry and exit point.
Conditions
- The price was correcting lower in the H4 and made the original bullish move by breaking out above the trendline.
- The price moved above the Dynamic EMA 20 in the H1 timeframe.
- Stochastic is at <20 areas.
- RSI is at <35 areas.
- MT4 Stop Level Reverse indicator shows the buy arrow below the price with Blue colour.
After matching all trading conditions, the trade is ready to enter.
Entry
The uniqueness of this trading strategy is that it uses both instant execution and limit orders.
After matching all conditions, you should open a Buy trade, and when the price moves towards the desired direction, you should open Buy limit order above the current market price based on these two scenarios:
- In H4 entry, the buy limit should be 70 to 100 pips above the entry-level.
- In H4 entry, the buy limit should be 30 to 50 pips above the entry-level.
Stop Loss
The EMA 20 works as a dynamic support level in this trading system. Therefore, the primary idea about the stop loss is to set it below this dynamic level with some buffer, as mentioned below:
- For H4 trading set the stop loss 10 pips below the EMA 20.
- For H1 trading set the stop loss 5 pips below the EMA 20.
Take Profit
This trading strategy has two trading entry (if the market allow). Therefore, the primary intension should be to take two take profit levels.
- At first, you should close the first trade at 1:1 R: R and make the second trade risk free by moving the stop loss at breakeven.
- Later on, close the second trade if the price slows down from an important resistance level and fails to break above it.
Buy Trading Example
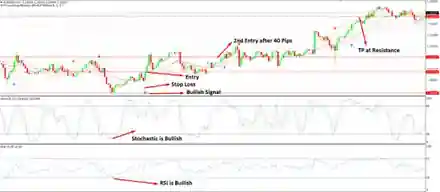
- In the above image, we can see the 1-hour timeframe of the EURUSD chart, where all trading conditions meet when the EURUSD price is at 1.2110.
- The stop loss level was below the entry candle and dynamic level of 20 EMA at 1.2059.
- However, after making a bullish move, the price corrects lower, and above the first entry price, the second trade was open at 1.2146.
- After taking both trades, the price made a sharp move upside, but it became slow after reaching the 1.2240 resistance where all of the trades were closed.
Bearish J9D Trading System
The Bearish trading system is also based on multi-timeframe analysis that is very logical and practical in the forex market. At first, we will get an overview of the price in the H4 timeframe and match the price direction in the H1 timeframe using the trend line breakout rules.
Moreover, you can apply this trading methodology in any pairs from EURUSD to exotics but make sure to focus on trading pairs that have low risks (usually major, minor and cross pairs).
Overall, the bearish trading strategy includes conditions that should meet at a price and the exact entry and exit point.
Conditions
- The price is correcting Higher in the H4 and made the original bearish move by breaking out below the ascending trendline.
- The price moved below the Dynamic EMA 20 in the H1 timeframe.
- Stochastic is at >80 areas.
- RSI is at >65 areas.
- MT4 Stop Level Reverse indicator shows the Sell arrow above the price with Red colour.
Entry
After matching all conditions, you should open a Sell trade from the next candle, and when the price moves towards the desired direction you should open Sell limit order above the current market price based on these two scenarios:
- In H4 entry, the Sell Limit should be 70 to 100 pips below the entry-level.
- In H4 entry, the Sell Limit should be 30 to 50 pips below the entry-level.
Stop Loss
The primary idea about the stop loss is to set it above this dynamic level with some buffer, as mentioned below:
- For H4 trading set the stop loss 10 pips above the EMA 20.
- For H1 trading set the stop loss 5 pips above the EMA 20.
Take Profit
This trading strategy has two trading entry (if the market allow). Therefore, the primary intension should be to take two take profit levels.
- At first, you should close the first trade at 1:1 R: R and make the second trade risk free by moving the stop loss at breakeven.
- Later on, close the second trade if the price slows down from an important Support level and fails to break below it.
Sell Trading Example
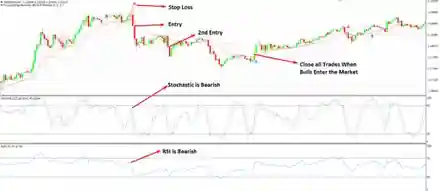
- In the above image, we can see the 1-hour timeframe of the EURUSD chart, where all trading conditions meet when the EURUSD price is at 1.1860.
- The stop loss level was above the dynamic level of 20 EMA.
- However, after making a bearish move, the price corrects higher, and below the first entry price, the second trade was opened after 40 pips movement.
- After taking both trades, the price made a sharp move, but the trade was closed when the price faced a bullish buy arrow indicating that bulls enter the market.
Summary
Let’s summarize The J9D Trading System For MT4.
- This trading system uses price action concept with the technical indicator.
- You can apply this trading methodology in any pairs from EURUSD to exotics.
- The trading entry is based on multiple confirmations where the Stop loss is below or above the dynamic level of EMA 20.
- The first take profit is at 1:1 R: R and second TP is based on important levels.