

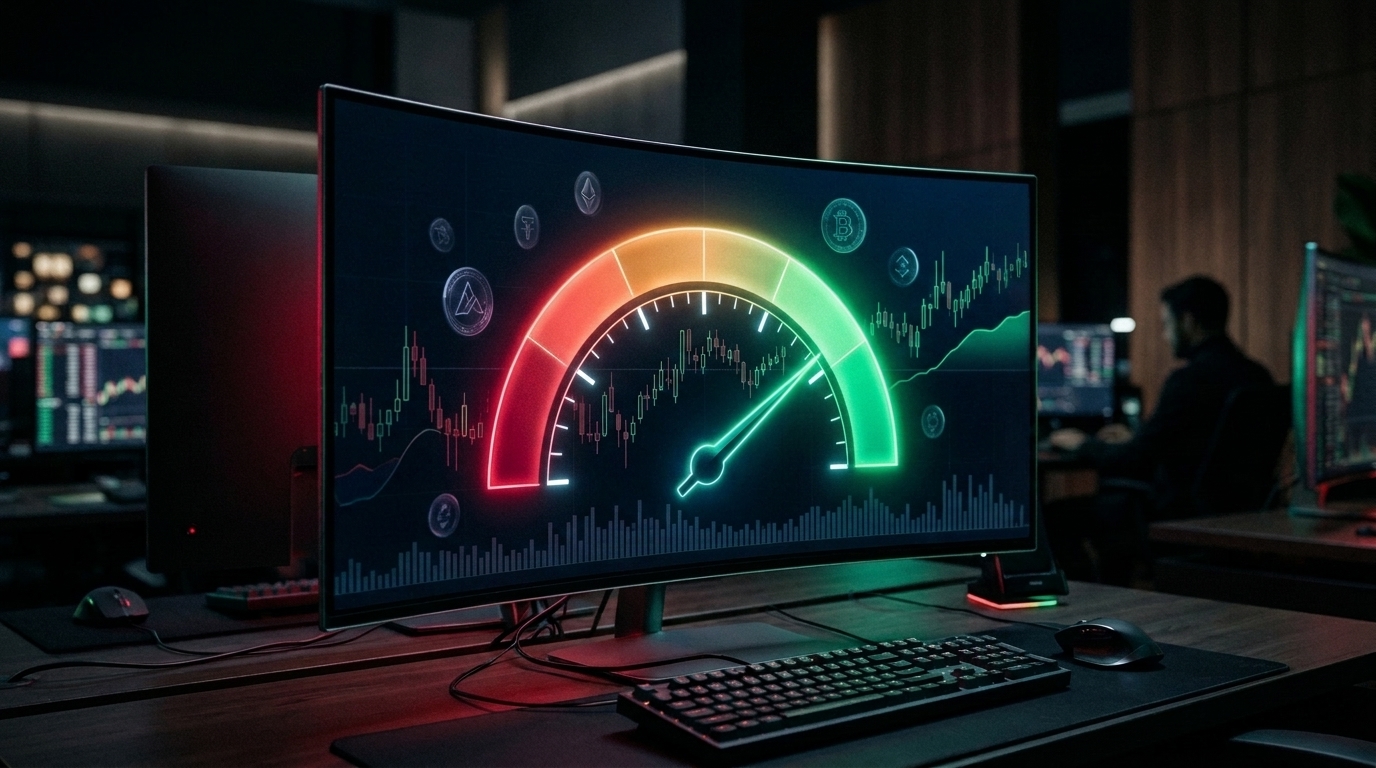


Financial investors face powerful psychological drivers while making trading decisions, where fear and greed dictate major market turns. The Crypto Fear and Greed Index quantifies these emotional extremes into an actionable sentiment gauge, helping traders identify macro exhaustion points and align with institutional liquidity. Here are the top 5 professional tips to trade with the Fear and Greed Index without blowing your account.
i Key Trading Takeaways
- Contrarian Market Edge: Extreme Fear (<20) historically highlights macro accumulation opportunities, while Extreme Greed (>80) warns of impending profit-taking tops.
- Multi-Source Sentiment: The index combines volatility, volume momentum, social media tracking, dominance metrics, and search trend queries.
- Confluence with Price Action: Never trade sentiment scores alone; confirm sentiment extremes with key technical support or resistance price reactions.
However, it is mandatory to understand the underlying mechanics alongside following strict execution guidelines when expecting to generate consistent trade ideas using sentiment indicators. Emotional overreaction in digital assets often traps retail participants at cycle turning points. This guide breaks down the core methodology of the Fear and Greed Index and outlines five essential risk rules to protect your capital.
What is the Crypto Fear and Greed Index?
The Fear and Greed Index is a multifaceted sentiment indicator designed to measure the emotional state of the cryptocurrency market on a daily scale of 0 to 100. Markets are driven by two dominant emotions: extreme fear causes market participants to panic-sell at steep discounts, while extreme greed fosters irrational exuberance and reckless over-leveraging.
The index is divided into four primary sentiment zones:
- Extreme Fear (0 – 24): Investors are exceptionally worried; historically indicates undervalued conditions and potential accumulation zones.
- Fear (25 – 49): Cautious sentiment with subdued risk appetite across major digital assets.
- Greed (51 – 74): Growing optimism, increased leverage, and speculative capital inflows.
- Extreme Greed (75 – 100): Overheated market conditions where retail euphoria precedes sharp market corrections.
How the Sentiment Score is Calculated
Unlike simple price momentum oscillators, the Crypto Fear and Greed Index aggregates data across five distinct pillars to construct a balanced sentiment score:
- Volatility (25%): Compares current volatility and maximum drawdowns against 30-day and 90-day averages. Unusual surges in volatility signal high market anxiety.
- Market Momentum & Volume (25%): Evaluates daily buying volume relative to multi-month averages. High volumes in an uptrend indicate healthy buying conviction.
- Social Media Sentiment (15%): Tracks hashtag frequency, sentiment polarity, and social interaction velocity across X (Twitter) and crypto discussion boards.
- Dominance Metrics (10%): Assesses Bitcoin dominance; rising BTC dominance typically reflects flight to safety from volatile altcoins, whereas declining dominance reflects risk-seeking greed.
- Google Search Trends (10%): Monitors search volume queries for terms such as “Bitcoin crash”, “buy crypto”, and “crypto trading”.
Top 5 Tips Not to Blow Your Account with FGI Strategy
While the Fear and Greed Index provides a powerful macro compass, trading sentiment in isolation can be disastrous. Follow these five battle-tested rules to maximize profits while strictly guarding your trading account:
Tip 1: Accumulate Long Positions During Extreme Fear (<20)
When the FGI prints below 20, forced liquidations and retail panic have generally reached peak exhaustion. However, do not execute a market buy blindly. Wait for price to reach a major weekly support zone and print a bullish reversal candlestick pattern (such as a hammer, bullish engulfing, or double-bottom) on the 4-hour or daily chart. This ensures that institutional buyers are actively defending the level before you commit capital.
Tip 2: Scale Out and Take Profits in Extreme Greed (>80)
During prolonged bull runs, sentiment can linger in Extreme Greed for several days or weeks as retail FOMO accelerates. Rather than attempting to pinpoint the exact top, establish a tiered profit-taking plan. Begin taking partial profits (e.g., 20% to 30% of position size) into liquidity spikes once the index crosses 80, and trail your stop-loss beneath key structural support.
Tip 3: Spot Sentiment Divergences
Some of the highest-conviction trading setups occur when price action and the sentiment index diverge. For instance, if Bitcoin makes a lower price low but the Fear & Greed Index records a higher low (recovering from 10 to 22), it indicates diminishing selling pressure and impending trend exhaustion. Conversely, if price pushes to new highs while the index fails to surpass previous greed readings, smart money is quietly distributing.
Tip 4: Never Use High Leverage on Sentiment Signals
Extreme Fear conditions can persist longer than expected during macro liquidity crunches or regulatory shocks. A common mistake among retail traders is opening high-leverage long positions simply because “the index is at 10.” If liquidation cascades continue, aggressive leverage will wipe out your margin before the rebound materializes. Keep spot allocations dominant or cap derivatives leverage strictly under 2x-3x.
Tip 5: Deploy Systematic Dollar-Cost Averaging (DCA)
Rather than committing 100% of your capital at a single sentiment reading, divide your allocation into multiple tranches. For example, deploy 25% of your target position when the index enters Extreme Fear (<25), another 25% at <20, and the remaining 50% upon confirmed structural breakout above the 50-day moving average. This disciplined DCA methodology smooths out volatility and guarantees optimal entry prices.
Related reading
- NUPL Crypto Strategy: Top 5 Tips
- Correlation Coefficient Indicator in Crypto Trading
- Crypto Correlation Strategy: Top 5 Tips
- Best 10 Crypto Trading Indicators













