

What is the crypto quad strategy? How does the crypto quad strategy work in the financial market? Let’s have a look at the complete investment guide. The quad trading strategy is an ideal approach to the financial market to generate constantly profitable trade ideas. Many successful financial investors use this concept frequently while making trade decisions, and therefore it makes sense that the quad trading concept can be helpful for crypto investors.
i Key Trading Takeaways
- Four-Tiered Trend Architecture: The 8 and 13 EMAs capture immediate momentum, the 21 EMA serves as dynamic pull-back support, and the 55 EMA sets macro directional bias.
- Fan Expansion Signals: When all four EMAs fan out in parallel alignment, it confirms strong momentum and ideal pull-back buying opportunities.
- Early Exit Triggers: An 8 EMA cross below the 13 and 21 EMAs signals rapid momentum exhaustion, alerting traders to scale out or trail stops tightly.
However, it is mandatory to have a proper understanding of any trading concept before using it for successful trading. This article enlights the Crypto quad trading method and describes sustainable trading strategies using chart attachments for better understanding. Later we list the top three pros and cons of the quad trading strategy so you can learn the potential.


What is the crypto quad EMA 8, 13, 21, 55 trading strategy?
The Quad trading strategy is a trading approach that allows investors to utilize multiple moving averages to a particular chart to determine trading positions. Investors can change the parameter values of different MA lines for flexibility while conducting analysis. The crypto quad EMA 8, 13, 21, 55 trading strategy involves using four different EMA lines to generate trade ideas on crypto assets.
How to trade using the crypto quad EMA 8, 13, 21, 55 trading strategy?
While using the crypto quad EMA 8, 13, 21, 55 trading strategy, it becomes easier to make trade decisions. It uses the MA crossover concept, which is popular among financial investors. In this case, investors use two or more crossovers to determine efficient entry/exit points of trades. For example, EMA 8, EMA 13, and EMA 21 lines cross the EMA 55 line on the upside, declaring a significant bullish pressure on the asset price. Meanwhile, the exact opposite crossover indicates declining pressure on the asset price. You can use this concept independently on many trading instrument charts or combine other technical tools and indicators for more efficient results.
Short-term trading strategy
In this trading method, we combine the quad EMA concept with another famous technical indicator, the Directional Movement Index (DMI) indicator. The DMI indicator is a unique indicator that results in an independent window containing three dynamic signal lines (DI+, DI-, ADX). When both indicators declare the market movement in a specific direction, we open trading positions. This method suits many trading assets in different time frame charts; we recommend using a 15 min or hourly chart to catch the most potent short-term trades.
Bullish trade scenario
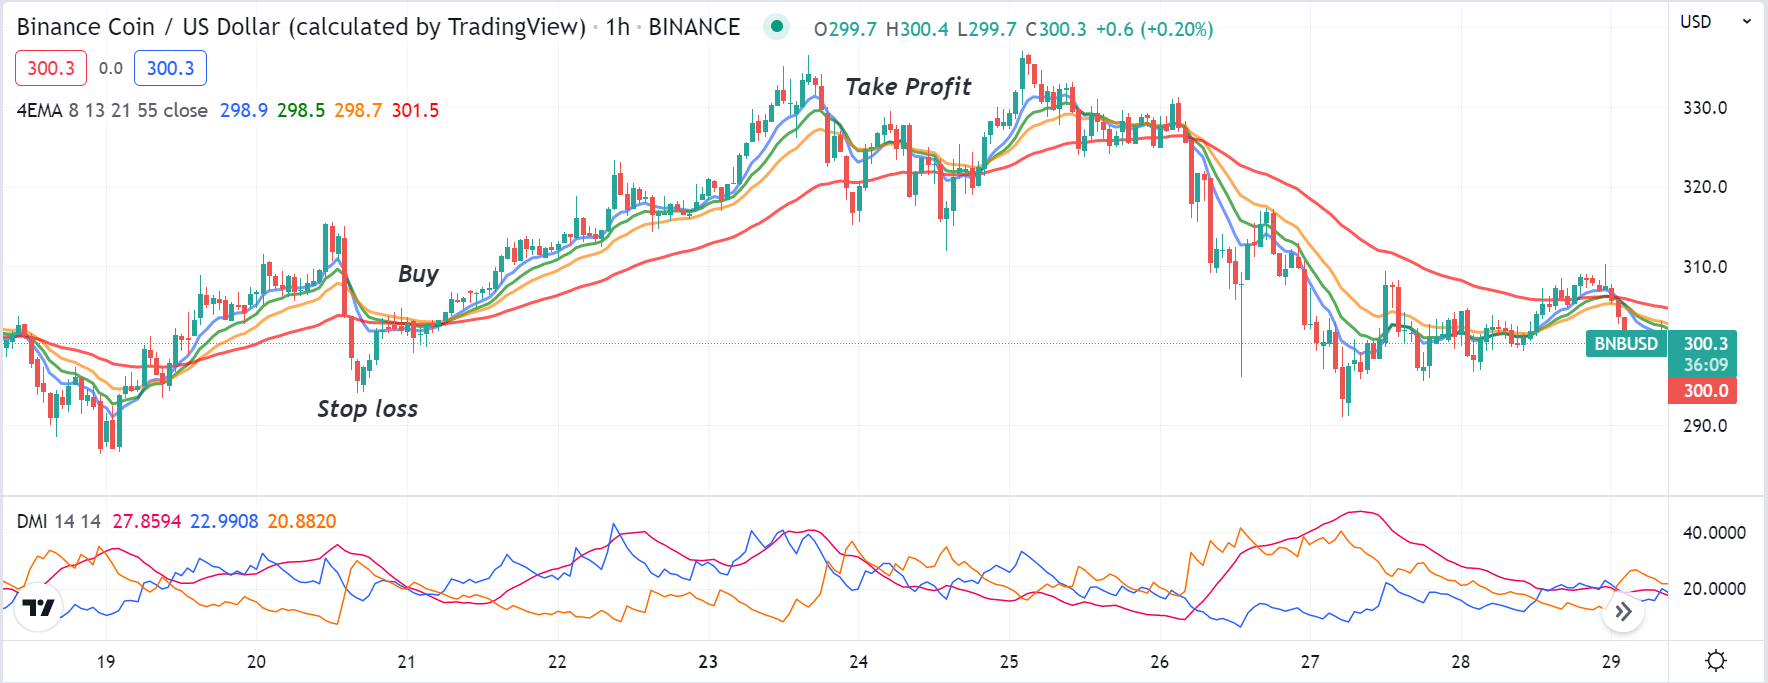
Apply both indicators in your target asset chart and seek opening long positions when the scenarios below appear:
- EMA 8 (blue) and EMA 13 (green) line reaches above the EMA 55 (red) line.
- The EMA 21 (yellow) line crosses above the EMA 55 (red) signal line.
- The DI+ (blue) line reaches above the DI- (orange) line at the DMI indicator window.
- The ADX value goes above 20 on the DMI indicator window.
Entry
Match these conditions above and open a long position.
Stop loss
The initial stop loss level will be below the recent swing low with a 5-10 pips buffer.
Take Profit
Close the long position when the scenarios below occur:
- The blue and the green EMA lines drop below the red EMA line.
- The DI+ (blue) line reaches below the DI- (orange) line at the DMI indicator window.
Bearish trade scenario
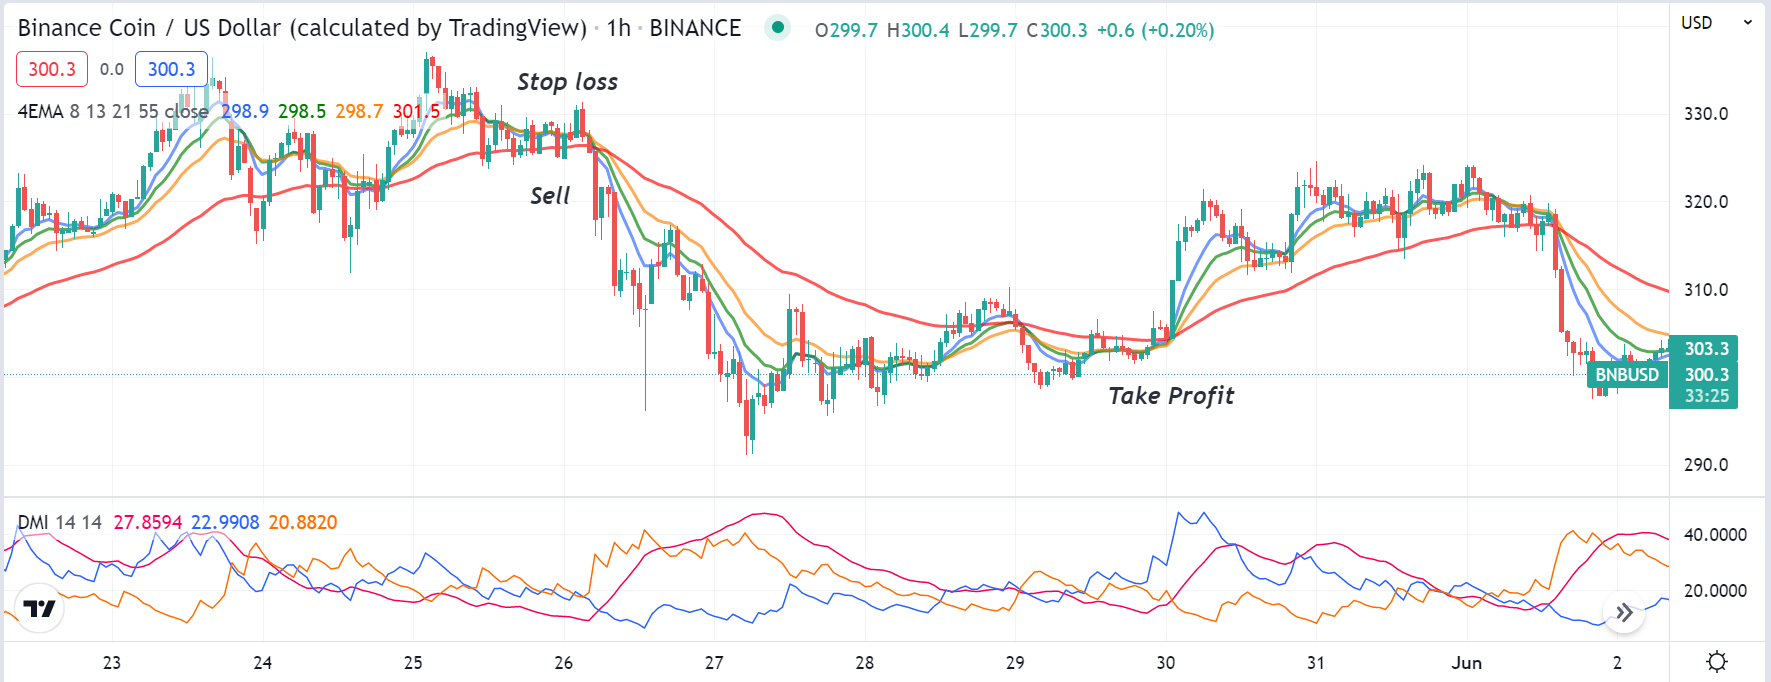
Apply both indicators in your target asset chart and seek opening long positions when the scenarios below appear:
- EMA 8 (blue) and EMA 13 (green) line reaches below the EMA 55 (red) line.
- The EMA 21 (yellow) line crosses below the EMA 55 (red) signal line.
- The DI+ (blue) line reaches below the DI- (orange) line at the DMI indicator window.
- The ADX value goes above 20 on the DMI indicator window.
Entry
Match these conditions above and open a short position.
Stop loss
The initial stop loss level will be above the recent swing high with a 5-10 pips buffer.
Take Profit
Close the short position when the scenarios below occur:
- The blue and the green EMA lines drop above the red EMA line.
- The DI+ (blue) line reaches above the DI- (orange) line at the DMI indicator window.
Long-term trading strategy
We use the RSI indicator as a supportive tool alongside the quad EMA concept to determine trading positions in this trading method. The RSI indicator is a popular momentum technical indicator with a dynamic signal line that moves within a range of 0-100. Any reading above the top (70) level declares overbought conditions on the asset price and beyond the bottom (30) indicates an oversold condition. We recommend applying this method on a D1 or H4 chart to get the best long-term trading ideas.
Bullish trade scenario
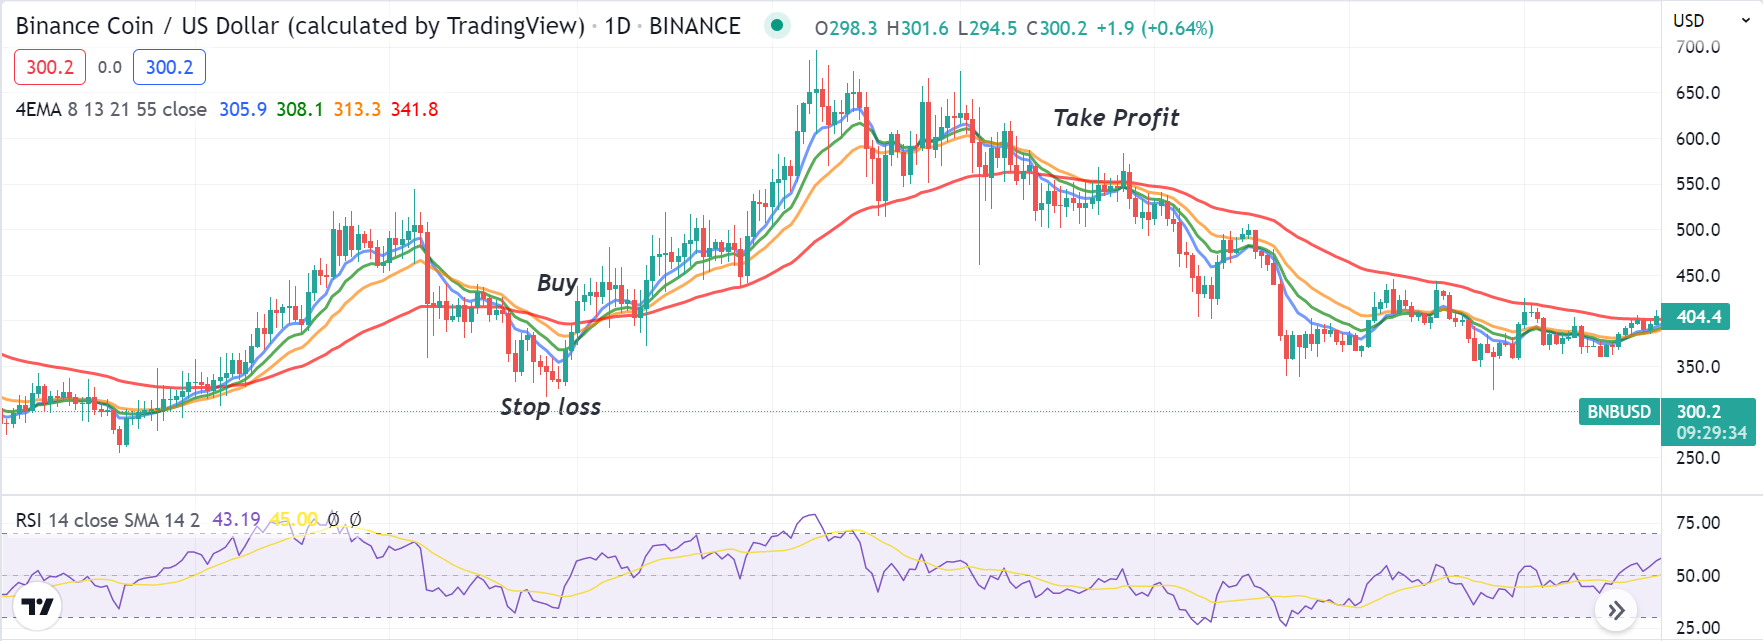
This method suggests opening buy positions when the conditions below match:
- The blue EMA line reaches above the red EMA line.
- The yellow EMA line crosses above the red EMA line.
- The RSI dynamic line stays near the central (50) level heads on the upside.
Entry
When these conditions above match your target asset chart, open a buy position.
Stop loss
Set an initial stop loss below the current bullish momentum.
Take profit
Continue your order till the price remains on the current uptrend. Close the position when the scenarios below occur:
- The blue EMA line drops below the red EMA line.
- The yellow EMA line drops below the red EMA line.
- The RSI dynamic line reaches near the upper (70) level or declines after getting that level.
Bearish trade scenario
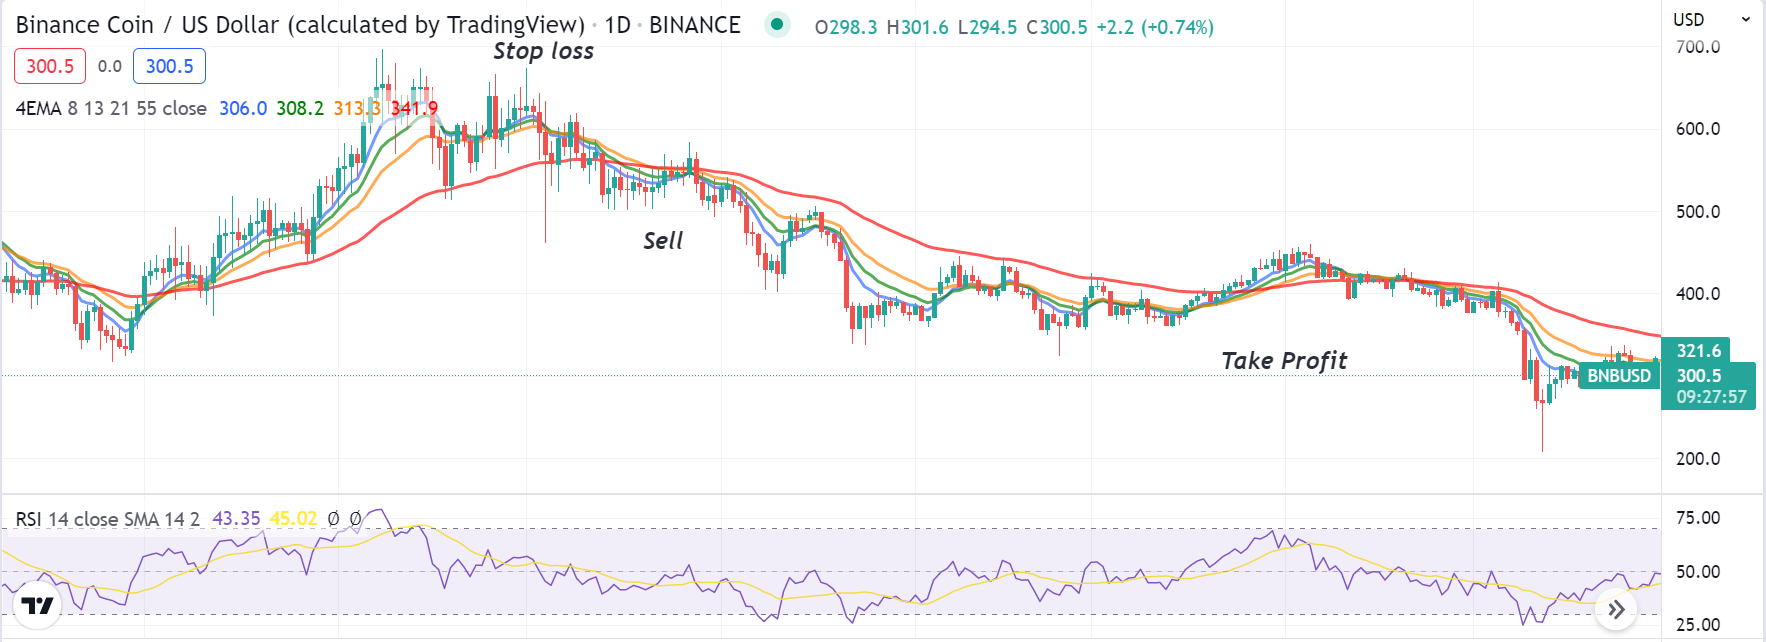
This method suggests opening sell positions when the conditions below match:
- The blue EMA line reaches below the red EMA line.
- The yellow EMA line crosses below the red EMA line.
- The RSI dynamic line stays near the central (50) level heads on the downside.
Entry
When these conditions above match your target asset chart, open a sell position.
Stop loss
Set an initial stop loss below the current bearish momentum.
Take profit
Continue your order till the price remains on the current downtrend. Close the position when the scenarios below occur:
- The blue EMA line gets above the red EMA line.
- The yellow EMA line gets above the red EMA line.
- The RSI dynamic line reaches near the lower (30) level or rises after getting that level.
Pros and cons
Pros
Cons
- This quad EMA concept is straightforward.
- The quad EMA concept only depends on technical market info.
- This concept applies to many trading instruments.
- This method is useless in consolidation phases.
- This concept allows the execution of both short-term and long-term term trade.
- This method can fail due to fundamental reasons.
Final thought
Finally, this article introduces a very potent technical concept of generating constantly profitable trade ideas. We suggest following proper trade and money management rules while using these strategies to trade cryptocurrencies, as cryptos are a new addition to the financial market and volatile assets.













