The Kama Strategy Trading System For MT4 is a forex intraday or swing trading strategy based on the KAMA indicator. It is a trend following strategy where we will focus on buyers' and sellers' activity in the price and ride the price towards the trend's direction.
📌 Strategy Summary & Key Parameters
- Strategy Name: The Kama Strategy Trading System For MT4
- Platform: MetaTrader 4 (MT4)
- Trading Style: Trend Following & Momentum Breakout
- Recommended Timeframes: M15, H1, H4, Daily
- Recommended Asset Classes: Major & Cross Currency Pairs (EUR/USD, GBP/USD, USD/JPY, EUR/JPY, GBP/JPY)
- Core Technical Tools: :, * Kaufman’s Adaptive Moving Average (KAMA)- value 2, * Simple Moving Average (SMA)- value 7, Let’s plot these indicat
- Risk Management: 1% to 2% risk per trade with 1:1.5+ Risk-Reward Ratio
Why is Trend Trading Profitable?
The trend is a market condition where the price aggressively moves above or below the recent swing levels at a tremendous speed.

Trending and ranging are common nature of trend for the forex market. The price barely creates a new high or low in a ranging market, and even if the price break above the recent swing level, it comes back with a false break. Therefore, in a ranging market, it is not easy to make money. However, a ranging market is the decision phase where institutional traders set the market direction.
On the other hand, the forex market moves like a zigzag where a bearish correction forms in a bullish trend, and a bullish correction forms in a bearish trend. Therefore, considering the strength of bulls and bears, we will follow the direction where the majority of traders are already following. In that case, we will determine the price direction based on Moving Average and KAMA.
What is KAMA?
KAMA or Kaufman's Adaptive Moving Average is a forex trading indicator, which is almost similar to the traditional simple moving average that moves within a dynamic line.
This indicator is very flexible in all timeframes where you can change the value to get the short term to long term trend direction. This indicator's primary idea is to identify the market trend by determining where the price is trading.
If the price is trading above the KAMA and making a higher high, the overall trend is bullish. On the other hand, if the price is trading below the KAMA and making a lower low, the overall trend is bearish.
On the other hand, the KAMA crossover works as an indication of a trend change. When the price break above or below the KAMA, it indicates that the trend is changing from bullish to bearish or bearish to bullish. However, in that case, you should use other confirmations to increase the trading probability.
The Kama Strategy Trading System For MT4
In this trading strategy, we will focus on KAMA and Simple moving average. Before getting into the trading logic, let's see the trading tools:
- Kaufman's Adaptive Moving Average (KAMA)- value 2
- Simple Moving Average (SMA)- value 7
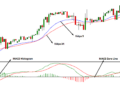
Let's plot these indicators in the chart and see how it looks like-
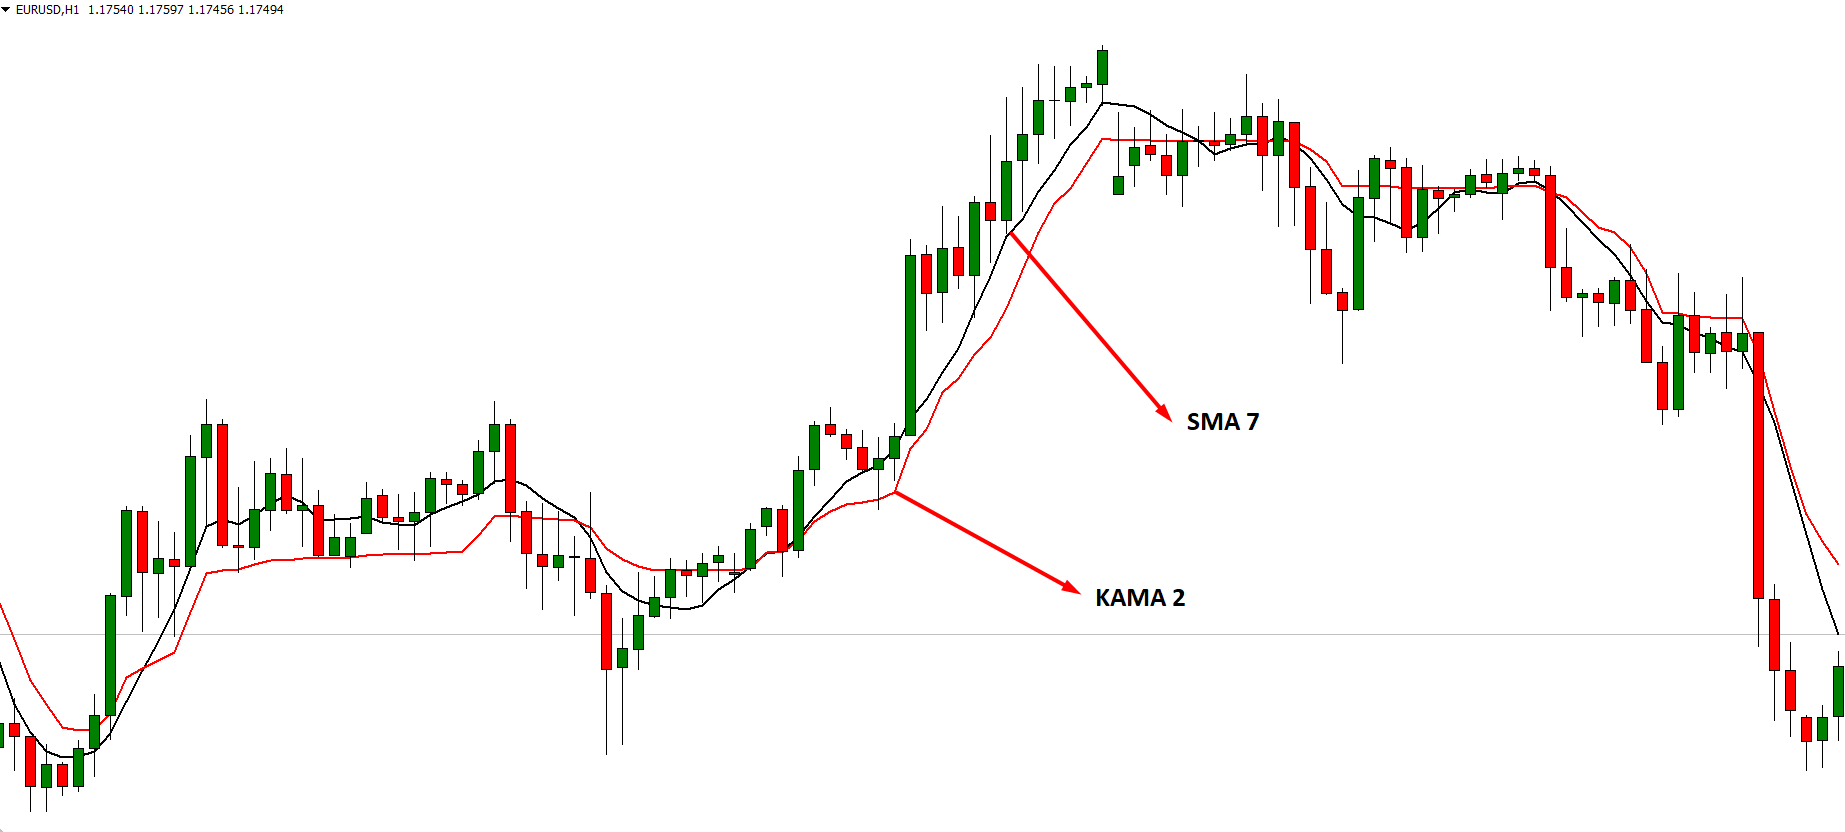
In this trading strategy, SMA 7 will indicate the long term trend idea of the price. If the price is trading above the SMA 7, the long-term trend is bullish, and if the price is trading below the SMA 7, the long-term trend is bearish.
After getting the idea of the long-term trend, we will focus on the KAMA. If KAMA 2 crosses the EMA 7, it will indicate that the short term trend becomes more potent than the long-term trend.
Bullish Kama Trading Strategy
The Kama trading strategy works well in all timeframes from m15 and currency pairs. However, you should avoid exotic pairs to keep the trading cost low. On the other hand, if you want to trade in M15 to the H1 timeframe, you should consider the trading session.
Bullish Trading Conditions
- The price is trading above the SMA 7, indicating that the long-term trend is bullish.
- KAMA 2 crosses above the SMA 7, pointing out that the short-term trend became more potent than the long-term trend.
- The price moved above the KAMA 2 and edging higher.
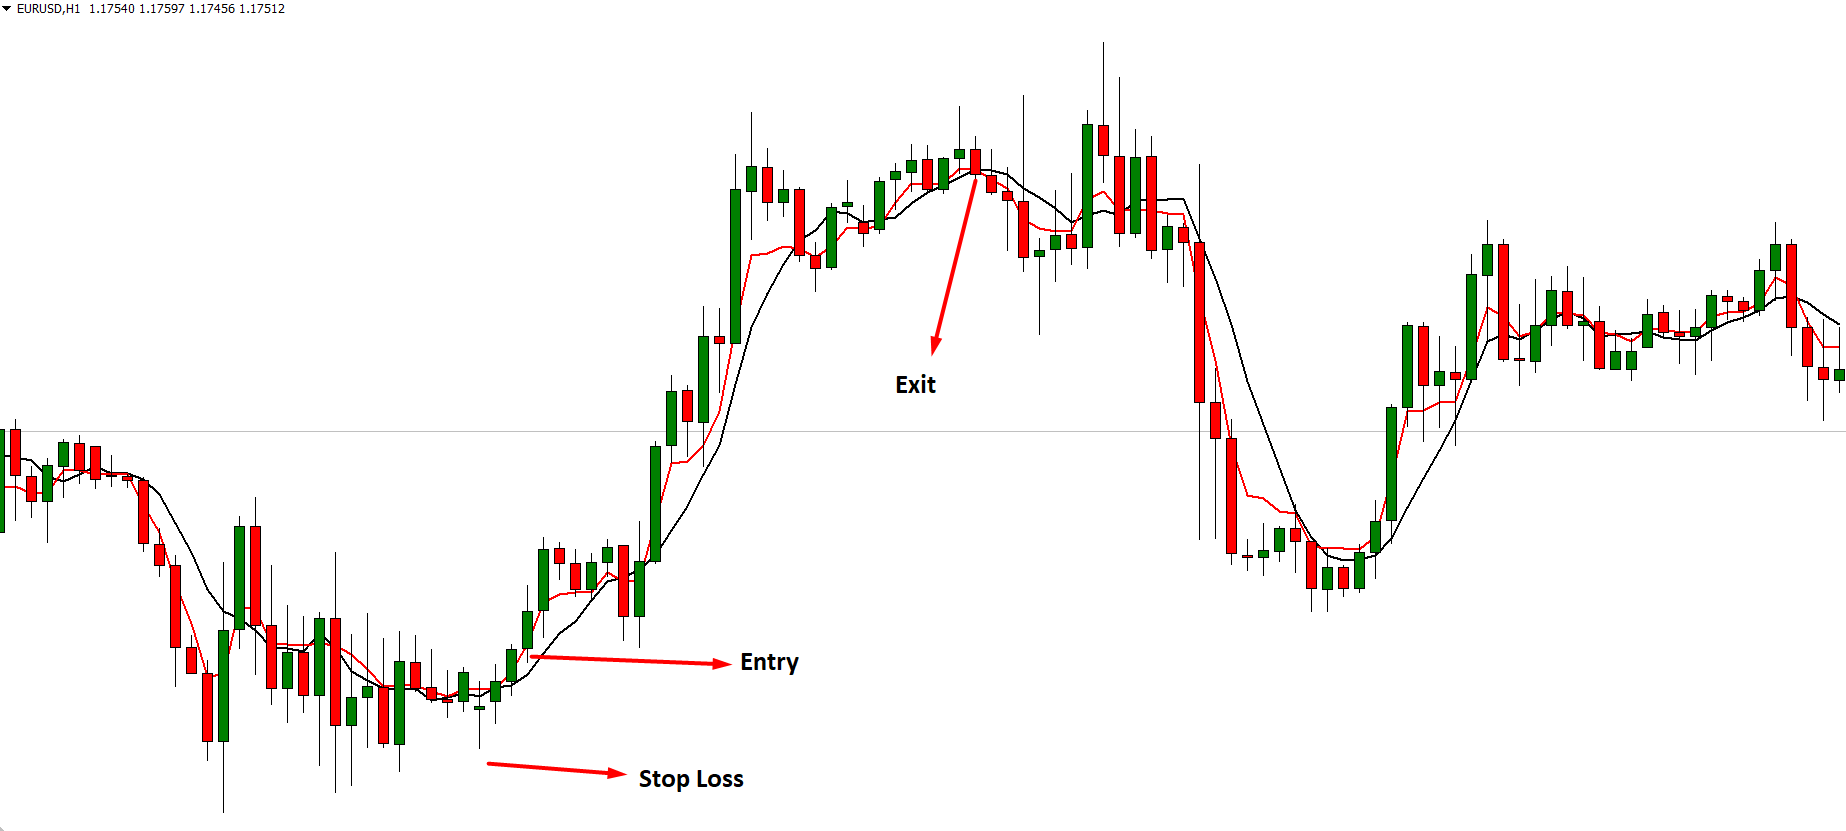
Entry
Before taking the trade, you should double-check the trading condition without any bias. Later on, enter the trade as soon as a bullish candle appears above the KAMA 2. Make sure that the bullish candle is strong compared to the average price.
Stop Loss
The bullish trading strategy is valid as long as the price is trading above the SMA 7. Therefore, you should put the stop loss below SMA 7 with some buffer.
Take Profit
The first take profit is when the price creates any new high where you should close 50% of the trade. Later on, you can close the full trade from any important swing high or when the KAMA 2 crosses down the SMA 7.
Bearish Kama Trading Strategy
The bearish trading strategy works well in all timeframes from m15 and currency pairs. However, you should avoid exotic pairs to keep the trading cost low. On the other hand, if you want to trade in M15 to the H1 timeframe, you should consider the trading session.
Bearish Trading Conditions
- The price is trading below the SMA 7, indicating that the long-term trend is bearish.
- KAMA 2 crosses down SMA 7, pointing that the short-term trend became more potent than the long-term trend.
- The price moved below the KAMA 2 and edging higher.
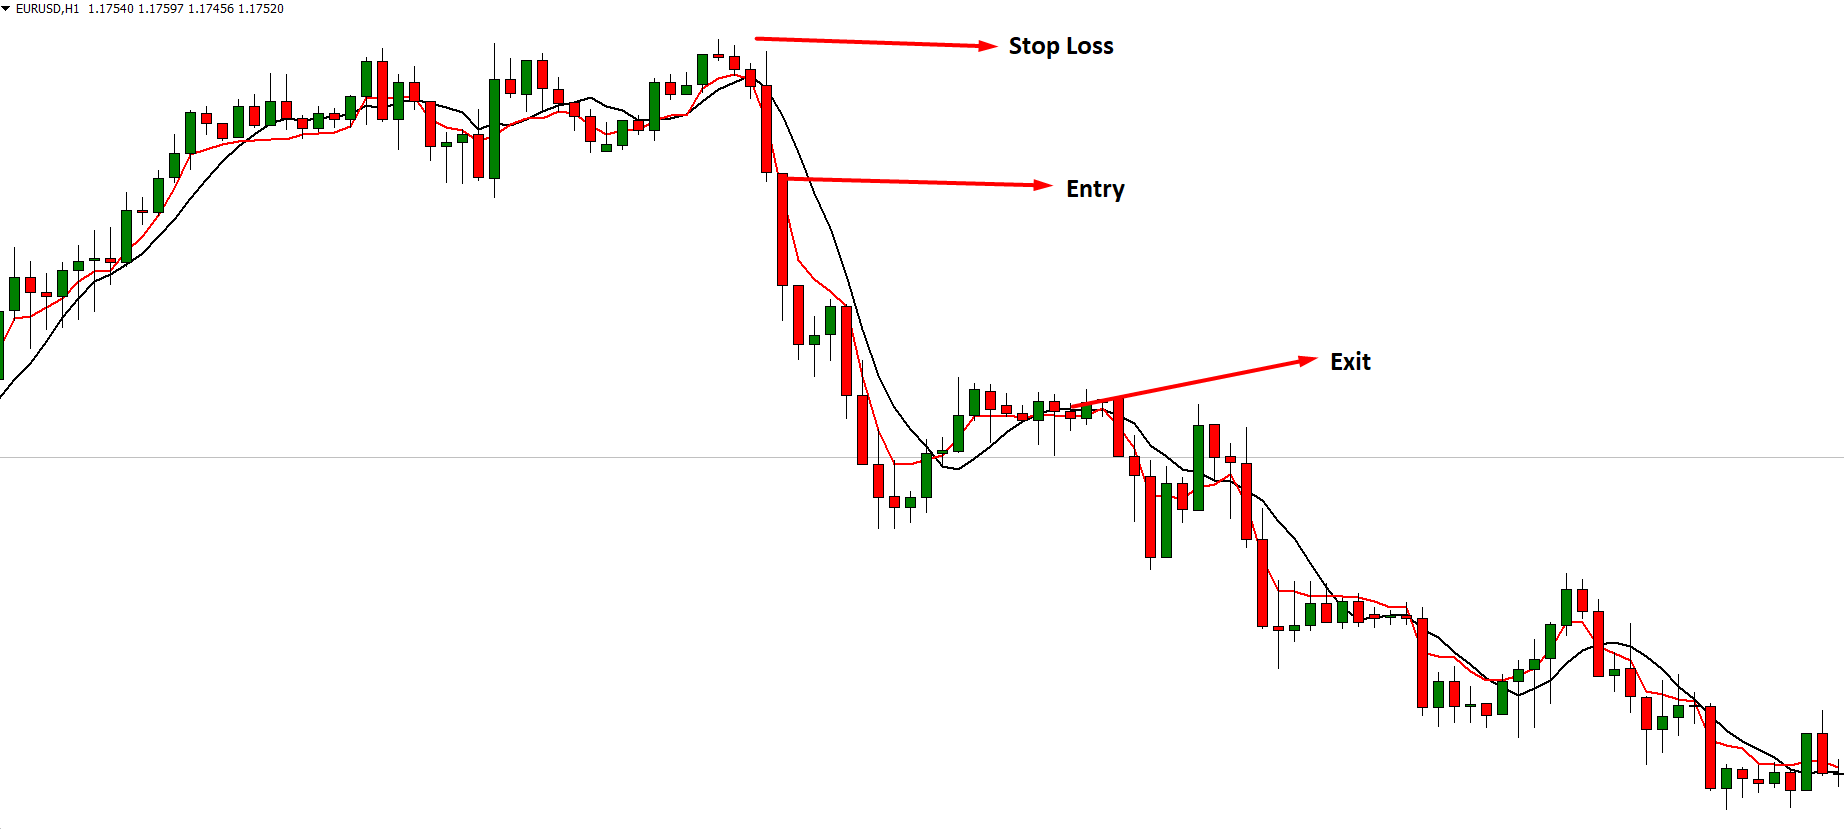
Entry
Before taking the trade, you should double-check the trading condition without any bias. Later on, enter the trade as soon as a bearish candle appears below the KAMA 2. Make sure that the bearish candle is strong compared to the average price.
Stop Loss
The bearish trading strategy is valid as long as the price is trading below the SMA 7. Therefore, you should put the stop loss above SMA 7 with some buffer.
Take Profit
The first take profit is when the price creates any new low where you should close 50% of the trade. Later on, you can close the full trade from any important swing low or when the KAMA 2 crosses above the SMA 7.
💡 Professional Execution Tip:
Always wait for the trigger candlestick to fully close before entering a market position. Entering prematurely during an open candle frequently results in false breakouts and wick traps. In addition, avoid opening new positions during high-impact macroeconomic releases (e.g., US Non-Farm Payrolls or CPI announcements) when spread spikes and slippage can distort indicator signals.
Conclusion
The Kama Strategy Trading System For MT4 is a profitable trading strategy, where you can make a decent profit every month. In this trading strategy, we can filter the trending movement be using SMA and KAMA indicators. Therefore, we can get the ultimate trading result by eliminating the unwanted noise from the corrective market momentum.
🔗 Recommended Related Strategies & Indicator Guides
- Relative Vigour Index (RVI) Strategy: Learn how to optimize measuring trend conviction at key support and resistance zones on active market charts.
- Crypto Quad EMA (8, 13, 21, 55) Strategy: Master multi-moving average momentum and trend continuation for higher accuracy setups.
- The Kiss H4 Strategy Trading System For MT4: Discover complementary rules and indicator setups to enhance your trading edge.
- The Mega Pips System For MT4: Explore alternative entry triggers and exit management for MT4 traders.
⚠️ Risk Warning: Foreign exchange and CFD trading carries a high level of risk to your capital and may not be suitable for all investors. Leverage can work against you as well as for you. Before deciding to trade foreign exchange, carefully consider your investment objectives, level of experience, and risk appetite. Never risk money you cannot afford to lose, and always thoroughly backtest trading strategies on a demo account before risking live capital.