The crypto marketplace has become one of the most exciting places for investors worldwide, as some have already made a fortune. Like most other financial assets, cryptocurrencies create various patterns while price shifting occurs. So, it is no wonder crypto investors use many technical tools and indicators to determine the market context and make trade decisions. Due to its attractive results, Ichimoku Cloud is one of the most typical technical indicators crypto traders prefer.
However, it is mandatory to understand any indicator’s functionalities, features, capabilities, potentialities, and limitations while using it to create any sustainable trading strategy. This article contains everything required to use the Ichimoku Cloud strategy most effectively in crypto trading.
What Is Ichimoku Cloud Strategy
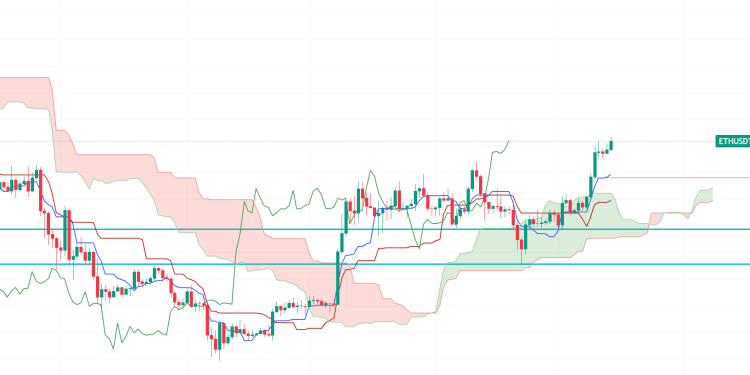
Ichimoku Cloud strategy refers to trading methods that involve using the Ichimoku Cloud indicator, also known as the Ichimoku Kinko Hyo indicator. Ichimoku Kinko Hyo is a technical indicator that displays various market contexts in any time frame chart, such as support-resistance, momentum, and trend direction. It usually collects multiple moving average data and shows them on the chart alongside using these data to compute “clouds,” which attempt to predict where the next support or resistance may take place.
The developer of this indicator is a Japanese Journalist named Goichi Hosoda, and the publication period is the late 1960s. He defines this indicator as a “one-look equilibrium chart,” which suggests potentially profitable trade ideas by calculating market data differently. It may not look straightforward at first glance, but it becomes very straightforward when you know the components and uses.
Components of the Ichimoku Cloud indicator are:
- Tenkan-Sen
- Kijun-Sen
- Senkou Span A
- Senkou Span B
- Chikou Span
Tenkan-Sen
It is the fastest and most active line. Traders also define it as a Conversion Line that often has a blue color in the built-in Ichimoku cloud on many trading platforms. Tenkan-sen calculation formula is:
Tenkan-Sen = (9-Period Highest High + 9-Period Lowest Low) / 2
Kijun-Sen
Many define this line as a baseline that follows the Tenkan-Sen line. The relationship between these two lines shares similarities with moving averages of 9 days and 26 days. The color of this line is often red; meanwhile, the Kijun-Sen calculation formula is
Kijun-Sen= (26-Period High + 26-Period Low) / 2
Senkou Span A
It is the average conversion of the Tanken-Sen and Kijun-Sen lines. Many define it as a Leading Span, a green line. Senkou Span A calculation formula is
Senkou Span A = (Tenkan-Sen + Kijun Sen) / 2
Senkou Span B
Many often define this as a Leading Span B through a red line. Senkou Span B calculation formula is
Senkou Span B = (52-Period High + 52-Period Low) / 2
Chikou Span
The Chikou Span, or lagging span, shows the default 26 past periods. When it crosses the price, candles on the downside signal bearish; if it crosses above the price, they signal bullish pressure on the asset price.
How To Trade Using Ichimoku Cloud Strategy
The Ichimoku Cloud Strategy requires successfully implementing the indicator on the target asset chart and observing to determine the best opportunities. The indicator shows various market contexts at once through different calculations. Crypto investors can use crossovers between Tenkan-sen and Kijun-sen for opening trades, as when the Tenkan-sen surpasses the Kijun-sen on the upside, it indicates a fresh bullish pressure on the asset price, and when the opposite crossover occurs, it expresses a bearish pressure. The Chikou Span A line stays above the Chikou Span B line, and the cloud must be green, which will declare the asset price as having an uptrend. Meanwhile, the opposite crossover between these lines (Chikou Span A and Chikou Span B) occurs during bearish price movement, and the cloud color will be red. The Chiko Span line remains above the price and declares an uptrend, and when it reaches below the price, it claims a downtrend.
Bullish Trade Setup
The indicator must be set on the target asset chart when seeking to open buy positions using the Ichimoku Cloud Strategy. It is better to choose assets with sufficient volatility. Check the scenario below before opening any position.
- The Tenkan-sen line reaches above the Kijun-sen line.
- The Chikou Span line remains above price candles.
- Price candles stay above the cloud (green or red).
Entry
When the conditions above match your target asset chart, wait until a green candle finishes and open a buy position.
Stop Loss
Place an initial stop loss below the current swing low.
Take Profit
This indicator indicates the buy order is safe until the cloud remains green; close the position when:
- The Tanken-Sen line reaches below the Kijun-sen line.
- The Chikou Span line is surpassing the price on the downside.
Bearish Trade Setup
When seeking to open sell positions, implement the indicator on the target asset chart with sufficient volatility and check the conditions below:
- The Tenkan-sen line reaches below the Kijun-sen line.
- The Chikou Span reaches below the price candles.
- Price candles get below the cloud (red or green).
Entry
When the conditions above match your target asset chart, wait until a red candle closes and open a sell position.
Stop Loss
Place an initial stop loss above the current swing high.
Take Profit
This indicator indicates the sell order is safe until the cloud remains red; close the position when:
- The Tanken-Sen line exceeds the Kijun-sen line on the upside.
- The Chikou Span line is surpassing the price on the upside.
Limitations Of Ichimoku Cloud Strategy
There are some limitations of the Ichimoku Cloud Strategy, such as
- It may not seem very easy to novice crypto traders.
- It only shows the results depending on the context of the technical market while ignoring fundamental facts.
- This indicator can fail in shorter time frame charts during volatility.
Final Thought
Finally, this article describes all the basics of the Ichimoku Cloud Strategy that any crypto investor needs to start trading using. We recommend checking upper timeframe charts for trend confirmation before entering trades, as it will help you open more precise trading positions. However, it requires sufficient practice to master the concept before applying it to live trading.


