
How to trade forex using the 52 weeks high trading strategy? Is it a reliable trading method? Let’s have a look at the complete 52 weeks trading system with examples.
52-Week High Trading Strategy
Time is a critical factor in the world of the financial market. Successful traders often observe the price movement of any financial asset to predict the future movement through specific periods, such as daily, weekly, monthly, yearly, etc. It enables traders to make more accurate trading positions.
However, successful trading through a specific time range requires an adequate understanding and applying that on trading charts. In this article, we describe 52-weeks high/low and how to trade with this concept. We describe two trading strategies with chart explanations depending on this concept; you can choose any one of these or both as your trading method if it suits your trading style.
What is the 52-week high/low?
You can count a 52-week high/low as a technical indicator for any financial asset. Many traders find these figures of high/low of any financial asset as an essential factor with current value to predict the future movement of the target asset.
This concept works fine on various trading assets such as currency pairs, commodities, stocks, securities, etc. Every year contains 52 weeks. The range of 52 weeks is ultimately the yearly range for any financial asset. The high/low of 52 weeks is the annual high/low of that asset. The calculation of finding these levels occurs by counting the closing prices, so you generate the actual price change during that period.
How to trade with 52-week high/low
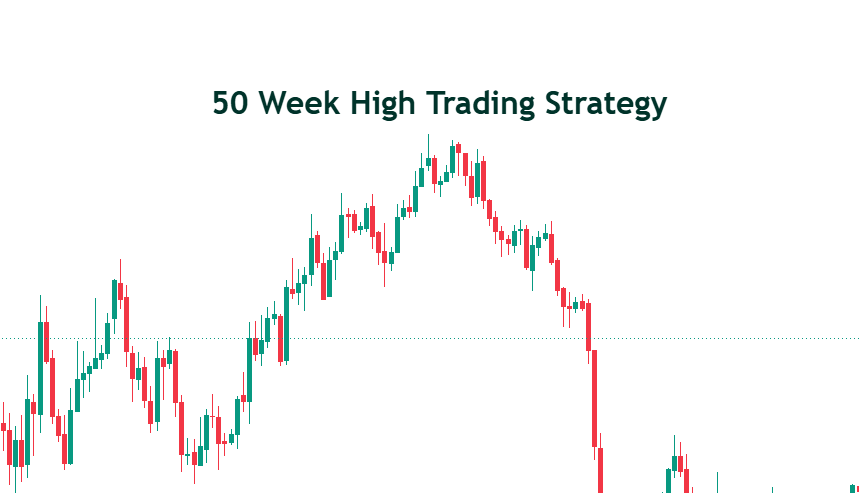
The low of a 52-week low usually acts as a support level. Meanwhile, the high during that period shows resistance. So it helps traders to make trade decisions. Any trader may have increasing buy or sell interest for a particular asset that may close near the 52-week low or high. The probability of the asset price flying upward from the low is expected if it closes near the 52 week low.
Gold weekly chart with 52 SMA
On the other hand, when the price reaches the high of the 52-week range, buyers may lose interest in buying and can be a selling opportunity. You use simply a Moving average value of 52 to generate the trade idea at the weekly chart. Otherwise, you can use other popular indicators such as Bollinger Bands, Relative strength index (RSI), MACD, Average True Range (ATR), etc., to generate trade ideas.
A short-term strategy
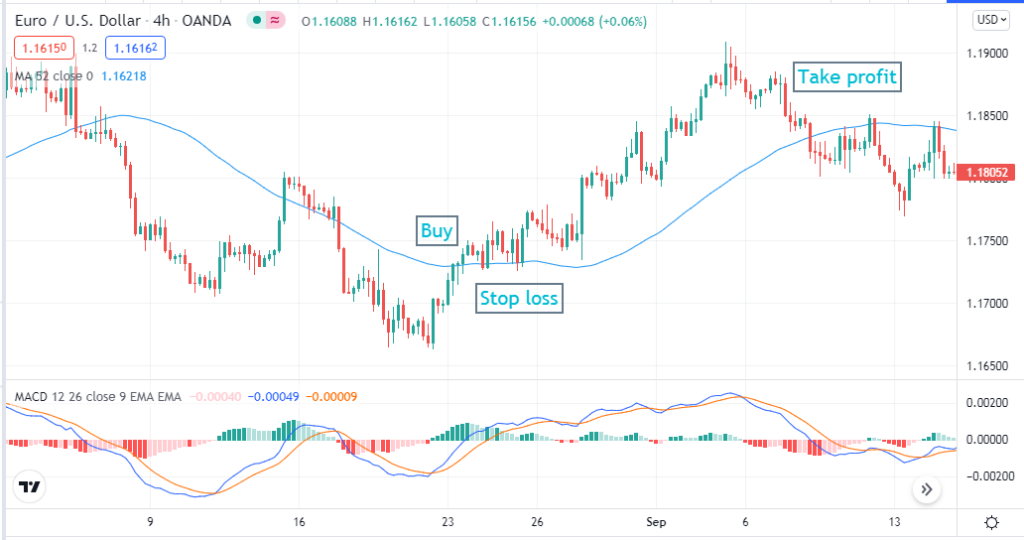
This trading method contains a simple moving average (52) besides another popular indicator moving average convergence/divergence (MACD). Applying these technical indicators on a 4-hour chart will show the best results. You can use this strategy to trade any trading asset that has sufficient volatility. The blue SMA (52) indicates the range of the asset price. When the price comes above the SMA line, it signals a buying opportunity. Inversely, when price candles reach below the blue SMA line, it declares a selling opportunity. MACD green histogram bars take place above the middle (0.0) line when the price remains uptrend.
Meanwhile, the blue signal line crosses above the red signal line of the MACD window, and both head toward the upside. The exact opposite cross-over occurs when the price gets to a downtrend. So the histogram bars also change color to red and appear below the middle (0.0) line of the MACD window.
Bullish trade setup
When you want to make buy check if
- Price candles are above the SMA (52) signal line on the chart.
- The dynamic blue line crosses above the dynamic red line of the MACD window.
- Both blue and red dynamic lines are heading toward the upside of the MACD window.
- MACD histogram bars are green and above the middle (0.0) line.
Bullish setup
Entry
Check all these conditions above are true, then place a buy order.
Stop loss
Set stop loss below the blue SMA line and the current swing low.
Take Profit
Exit from the buy position when
- Price candles come at the SMA line and or cross below it.
- Red histogram bars show up below the middle line of the MACD window.
- The Blue signal line crosses below the red signal line on the MACD window.
Bearish trade setup
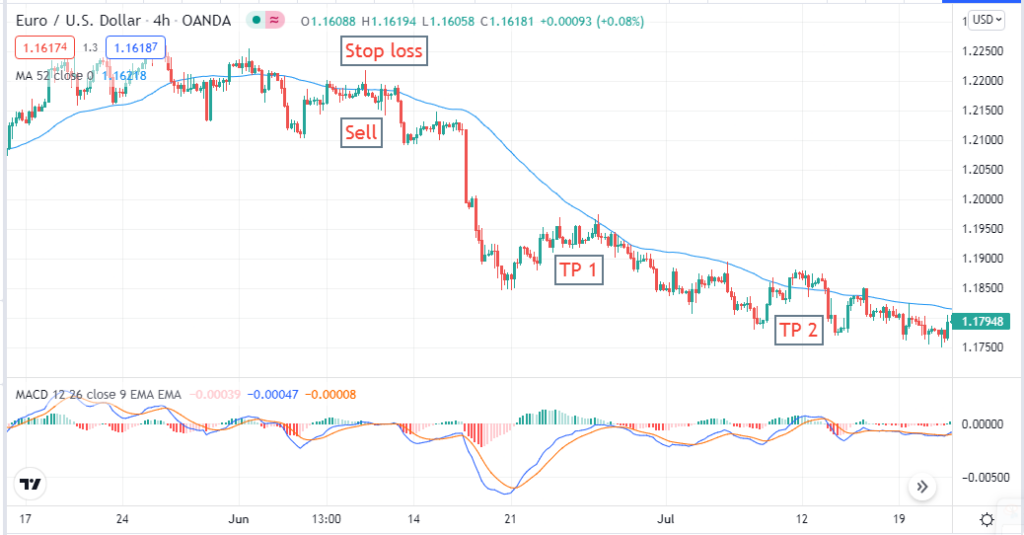
When you want to make sell check if
- Price candles are below the SMA (52) signal line on the chart.
- The dynamic blue line crosses below the dynamic red line of the MACD window.
- Both blue and red dynamic lines are heading toward the downside of the MACD window.
- MACD histogram bars are red and below the middle (0.0) line.
Bearish setup
Entry
Check all these conditions above are true, then place a sell order.
Stop loss
Set stop loss above the blue SMA line and the current swing high.
Take Profit
Exit from the sell position when
- Price candles come at the SMA line and or cross above it.
- Green histogram bars show up above the middle line of the MACD window.
- The Blue signal line crosses above the red signal line on the MACD window.
A long-term strategy
In our long-term trading strategy, we use a simple moving average (52) line on the weekly chart of the target financial asset. This trading method is so simple and easily applicable. This strategy is not suitable if you want to make frequent trading positions.
Bullish trade setup
This strategy will give you trade suggestions to hold any position for longer periods.
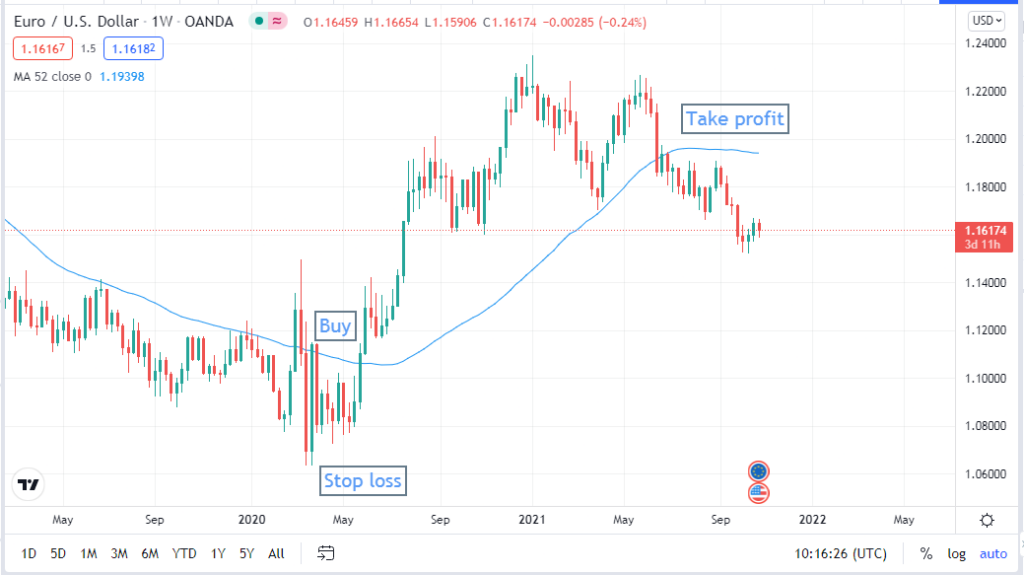
Bullish setup
Entry
When the price reaches above the SMA line, wait till the current bullish candle closes. Place buy order.
Stop loss
Place a stop loss below the SMA line and the current swing low.
Take profit
Exit from the buy position when the price reaches the SMA line or cross below it.
Bearish trade setup
This strategy will give you trade suggestions to hold any position for longer periods.
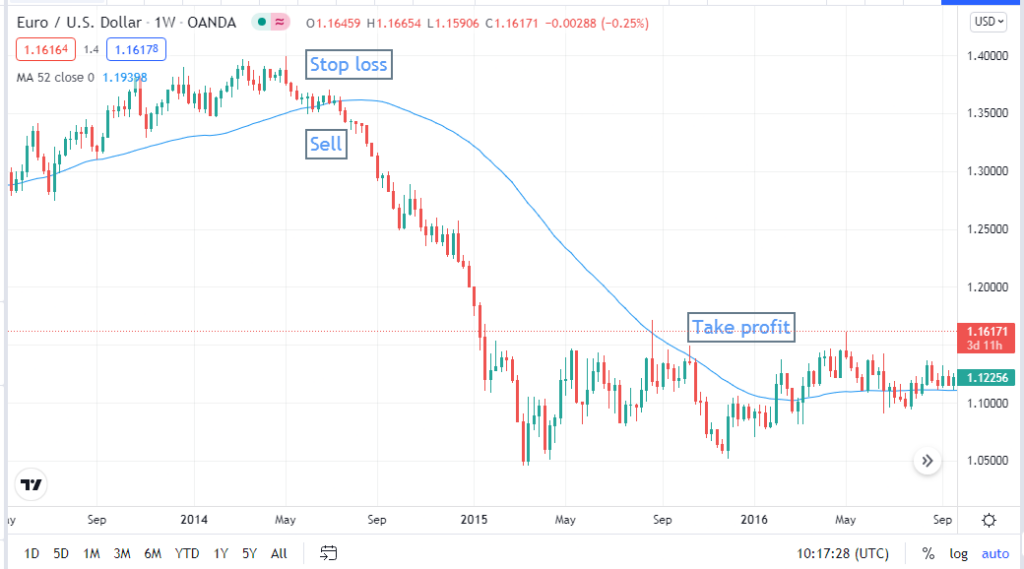
Bearish setup
Entry
When the price reaches below the SMA line, wait till the current bearish candle closes. Place sell order.
Stop loss
Place a stop loss above the SMA line and the current swing high.
Take profit
Exit from the buy position when the price reaches the SMA line or cross above it.
Pros and cons
The top three pros of this strategy are
- It will give you a good return.
- Can trade many financial assets with this strategy.
- It is a prevalent technique for successful traders to learn the potentiality of the asset.
The top cons of this strategy are
- You have to hold positions for a longer time.
- An overnight carry trade involves increasing costs.
- This strategy can fail due to any significant macro or microeconomic events.
Final thought
Finally, these are the most common info about the 52-week high/low strategy. We hope you find it enjoyable and educational. We suggest practicing demo trading before applying any of these strategies to your trading account.