
Financial traders involve making trade decisions by relying on many candlestick patterns. So learning to spot many candlesticks formations has become a widespread practice among traders for achieving skills. The ABCD pattern is a typical formation in the financial market that allows making several types of trading positions, becoming famous among financial traders.
However, it is somehow not wise to expect to obtain the best results through any candlestick pattern without complete understanding. The following section will reveal all primary explanations of the ABCD pattern besides trading strategies.
What is the ABCD pattern strategy?
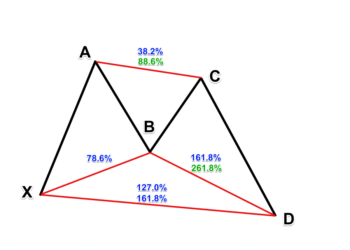
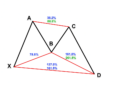
The ABCD pattern is a common form in the financial market that reflects a rhythmic style of the price movements. This pattern is easy to identify, which contains two equivalent price legs. You can consider the ABCD pattern a harmonic pattern, and many traders use this pattern to determine the market context or predict future movements. This pattern is so famous as many traders consider this as a basis of other patterns. There are two types of ABCD patterns: Bullish formation and Bearish formation.
Bullish ABCD
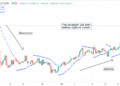
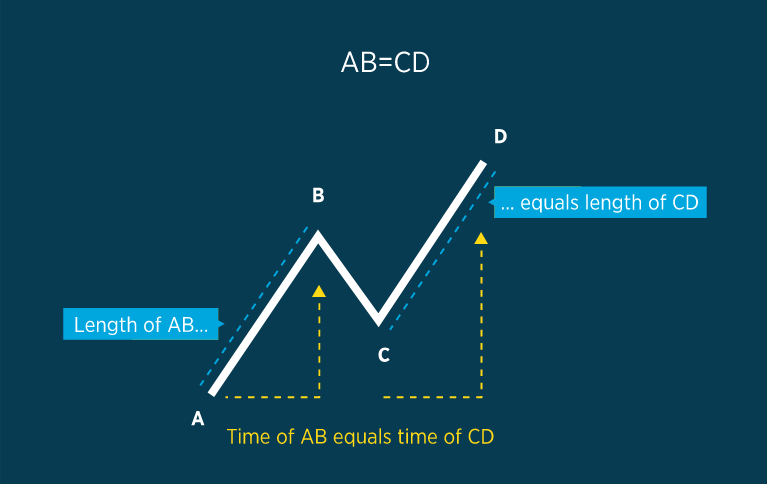
In bullish formation, the initial movement or AB is bullish. Then price retraces or declines back to point C. The bullish momentum returns after reaching that point, and the price reaches the D point. In this case, point C is a support level.
Bullish ABCD
Bearish ABCD
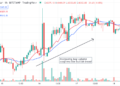
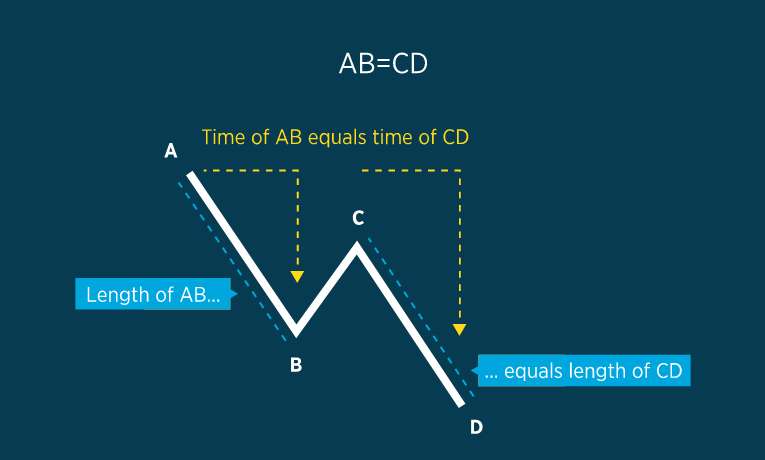
The initial or AB is a bearish movement due to declining pressure. Then the price returns to the C point and creates the BC bullish, and the price starts to fall from point C. So the final or CD leg will be bearish. In this case, point C is a resistance level.
Bearish ABCD
In both cases, the AB is similar to the CD. AB and BC are legs, and the BC is a correction or retracement. Any trading method that uses this pattern to determine trading positions is an ABCD pattern strategy.
How to trade with the ABCD pattern strategy?
In this part, we will explain successful trading ideas by using the ABCD pattern. In bullish ABCD formation, each point declares:
- A= A morning rise or initial bullish movement.
- B= A consolidation or a mid-day pullback.
- C= A higher low above point A and the last bullish momentum initiates here.
- D= The new high
These points are precisely the opposite in the bearish ABCD pattern. Trade executions are comparatively straightforward using an ABCD pattern. Bullish and bearish, both ABCD patterns enable placing buy/sell orders. In bullish ABCD, when the price reaches point B, bearish momentum initiates so you can place a sell order here. But it is wise to place a buy order near point C as it is easier.
On the other hand, placing a sell order near the C point of the bearish ABCD is a precious decision. You can trade by following the steps below:
- Identify the pattern first and check supportive indicators and tools.
- Keep patience till the price reaches your target level.
- Combine the pattern info with other technical indicators and tools.
- Execute trades according to your method.
- Close your positions when the price reaches your profit target level.
In this article’s trading method, we use the ABCD pattern alongside the RSI indicator and the Fibonacci retracement tool to determine trading positions.
Bullish trade setup
When seeking to open buy positions, spot the AB first, a bullish price movement. Then follow the steps below:
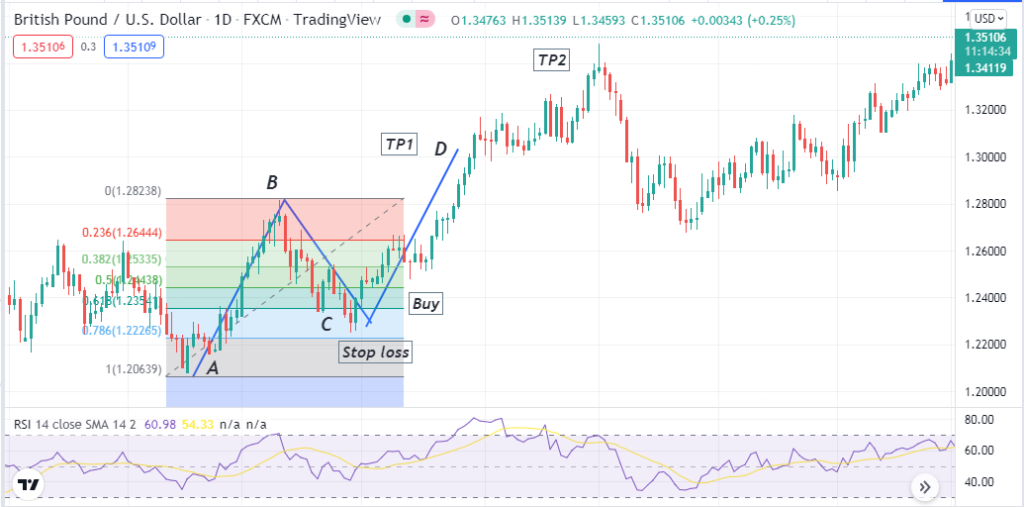
- Set the Fibonacci retracement tool from the A to B point.
- Wait until the price declines to point C, which will be lower low above the A point.
- The price usually makes corrections near 61.8-80% level of the Fibonacci retracement tool.
- The RSI line is above the central (50) line and heading upside.
Bullish setup
Entry
When your chart matches these conditions above, it signals a potential upcoming bullish price movement. Open a buy position near point C.
Stop loss
The initial stop loss will be below point C.
Take profit
The initial profit target will be above the same distance from point C as the AB, where you expect to form the D. You can continue the buy order if the bullish momentum remains intact and close it by following the reading of the RSI indicator.
Bearish trade setup
When opening sell positions using this method, spot the AB first, a bearish price movement. Then follow the steps below:
- Set the Fibonacci retracement tool from the A to B point.
- Wait until the price rallies to point C, a higher high below the A point.
- The price usually makes corrections near 61.8-80% level of the Fibonacci retracement tool.
- The RSI line is below the central (50) line and heading downside.
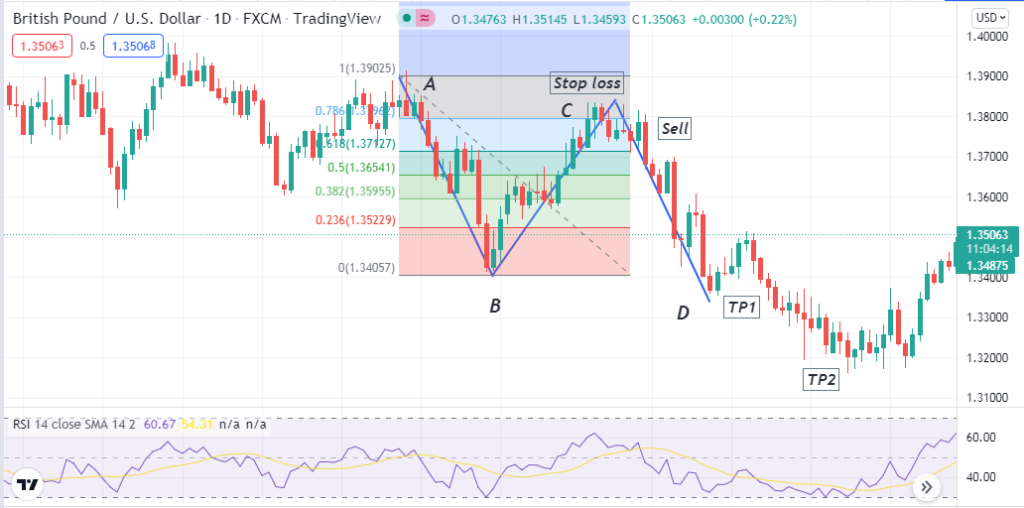
Bearish setup
Entry
Your chart matches these conditions above and signals a potential upcoming bearish price movement. Open a sell position near point C.
Stop loss
The initial stop loss will be above point C.
Take profit
The initial profit target will be below the same distance from point C as the AB, where you expect to form the D. You can continue the sell order if the bearish momentum remains intact and close it by following the reading of the RSI indicator.
How to manage risks?
Trading in the financial market involves several risks, as many factors affect the price movement. Traders usually follow technical, fundamental and sentiment info to generate trade ideas. The top tips for managing risks using this trading method are:
- Don’t make early entries; wait till the price reaches your target level before opening any position.
- Another common mistake that traders make while using this pattern for trading is that they often enter trading with lousy risk/reward. Try to open positions with good risk/reward.
- Don’t use this method on smaller time frame charts, such as 1-min or 5-min. Use timeframes of 15-min or above to apply this method. Moreover, we suggest using multi-timeframe analysis while using this trading strategy. That will increase your profitability by determining the actual price direction through looking at the asset price using birds-eye views.
Final thought
Commonly, the price makes retracements after making a significant trend in any direction. This ABCD pattern supports this typical concept of the financial market. Moreover, usually, you can open positions using this pattern on any trading asset, including currency pairs, stocks, indices, etc. This setup usually generates the best trades setups by combining three sectors: time, price, and shapes. Combining these will generate the best trading signals of continuation or reversal when you combine these three correctly.