
Technical indicators allow crypto traders to buy on the dip and exit from buying or enter short trades at the peak. Bar strength index indicator is a straightforward technical indicator and among the top list that helps traders participate in the most reasonable prices.
However, it is mandatory to have a clear concept and understanding of the functionalities of any indicator while seeking to use that to execute successful trades. This article will reveal the Bar Strength Index (BSI) indicator. Moreover, it contains sustainable crypto trading strategies using BSI with chart attachments.
What is the Bar Strength Index indicator?
The Bar Strength Index indicator is a simple and complete new technical indicator that evaluates the market data by unique calculation. It shows readings on an independent window. Many financial investors try to classify this indicator to the Relative Strength Index (RSI), which is wrong as the BSI indicator can give an edge through its calculation method that doesn’t work for the RSI indicator.
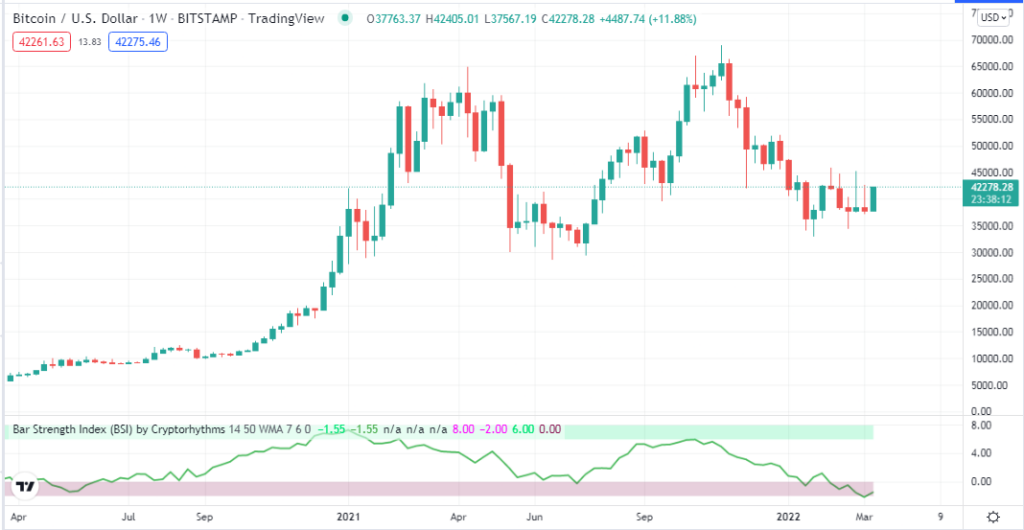
BSI indicator on an weekly chart of BTC
The Bar Strength Index (BSI) comes from the indicator Internal Bar Strength (IBS), successfully working on many financial assets like commodities, stocks, indices, etc., over the past thirty years. The IBS indicator allows investors to open sell positions on strengths and open buy positions at weaknesses. The calculation formula of the BSI indicator is
IBS = (close – low) / (high – low) * 100
How to trade using the Bar Strength Index indicator?
The BSI is a simplistic technical indicator on any financial asset chart. When trading cryptocurrencies using this indicator, it suits fine on upper timeframe charts, including daily, weekly, monthly, etc. The developer takes the original Internal Bar Strength (IBS) formula to create something smoother and delivers BSI. This indicator window has an upper green zone level and a lower redzone level indicating extreme strength and decreasing strength on the asset price. The BSI dynamic line reaches those levels according to the market context and participant’s actions. You can use this indicator independently to generate trade ideas or combine it with other technical indicators and tools to determine the most potential trading positions.
Short term trading strategy
We use the volume and parabolic SAR alongside the Bar Strength Index indicator to determine the most potent short-term trading positions in this trading method. The parabolic SAR declares the swing points of price movements; then, we check the volume and the BSI indicator readings to confirm the direction before entering any trade. This strategy suits many time frames to use at least an H1 chart when seeking trading positions.
Bullish trade scenario
Apply all three indicators and observe when-
- Parabolic dots take place below price candles and start making series.
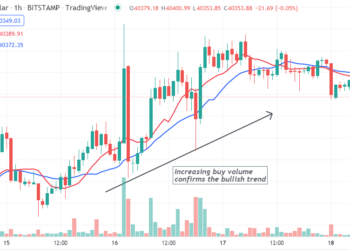
- The volume indicator declares an increasing buying pressure on the asset price.
- The BSI dynamic line is at or near the red zone declaring the low strength.
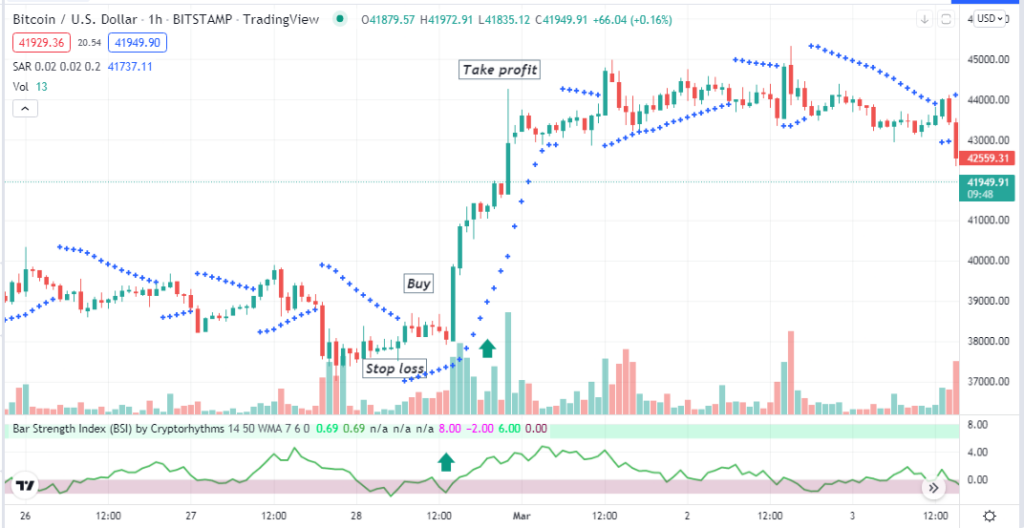
Bullish setup
Entry
When these conditions above match your target asset chart, it indicates potential bullish pressure on the asset price. Place buy order.
Stop loss
The initial stop loss level will be below the current bullish momentum with a buffer of 5-10pips.
Take profit
Continue the buy order till the price continues to go upside. Close the buy order when-
- The parabolic SAR dot switches on the upside of price candles.
- The volume indicator declares increasing sell pressure.
- The BSI dynamic line dropping at the red zone declaring decreasing strength after reaching toward the greenzone.
Bearish trade scenario
Apply all three indicators and observe when-
- Parabolic dots take place above price candles and start making series.
- The volume indicator declares an increasing selling pressure on the asset price.
- The BSI dynamic line is at or near the red zone declaring the low strength.
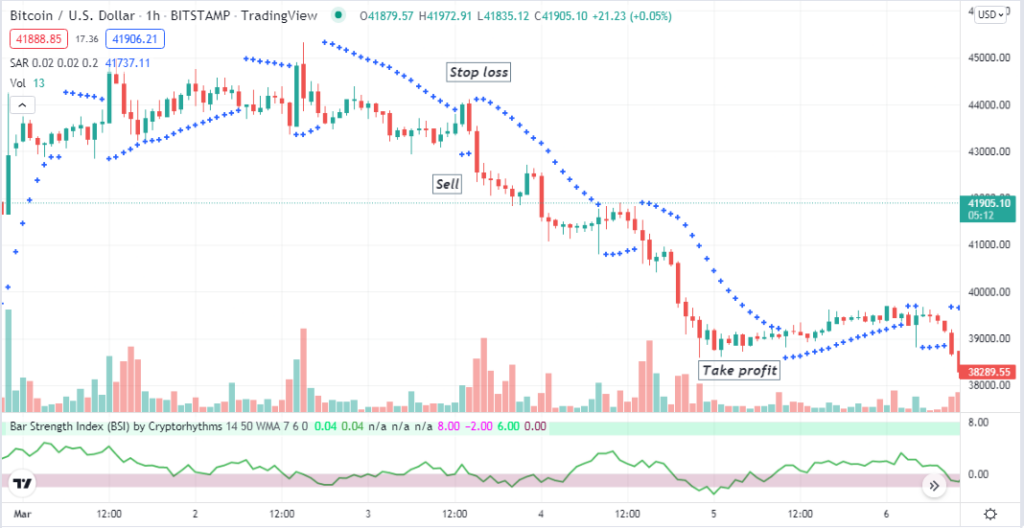
Bearish setup
Entry
When these conditions above match your target asset chart, it indicates potential bearish pressure on the asset price. Place sell order.
Stop loss
The initial stop loss level will be above the current bearish momentum with a buffer of 5-10pips.
Take profit
Continue the sell order till the price continues declining. Close the sell order when-
- The parabolic SAR dot switches on the downside of price candles.
- The volume indicator declares increasing buy pressure.
- The BSI dynamic line dropping at the red zone declaring decreasing strength after reaching toward the greenzone.
Long term trading strategy
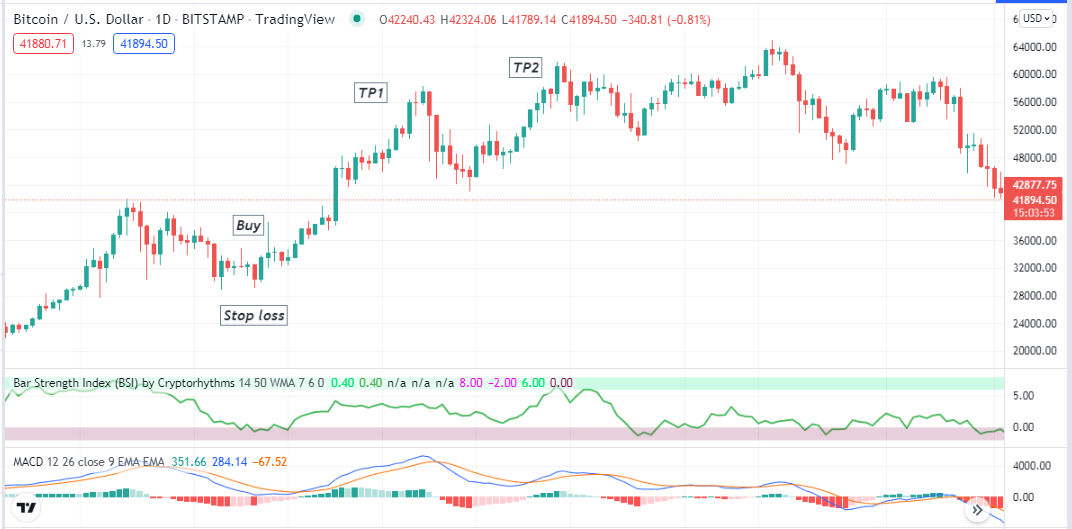
In this trading method, we combine readings of the BSI indicator with another popular indicator, the MACD. Both indicators show readings on independent windows. This trading method suits any financial asset, including cryptocurrencies. We recommend using a daily or weekly chart to determine trading positions through this trading strategy.
Bullish trade scenario
Implement both indicators at your target asset chart and observe when-
- The BSI dynamic line remains at or near the lower red zone or starts bouncing upside after getting that level.
- The dynamic blue line crosses the dynamic red line on the upside at the MACD indicator window.
- MACD green histogram bars take place above the central line.
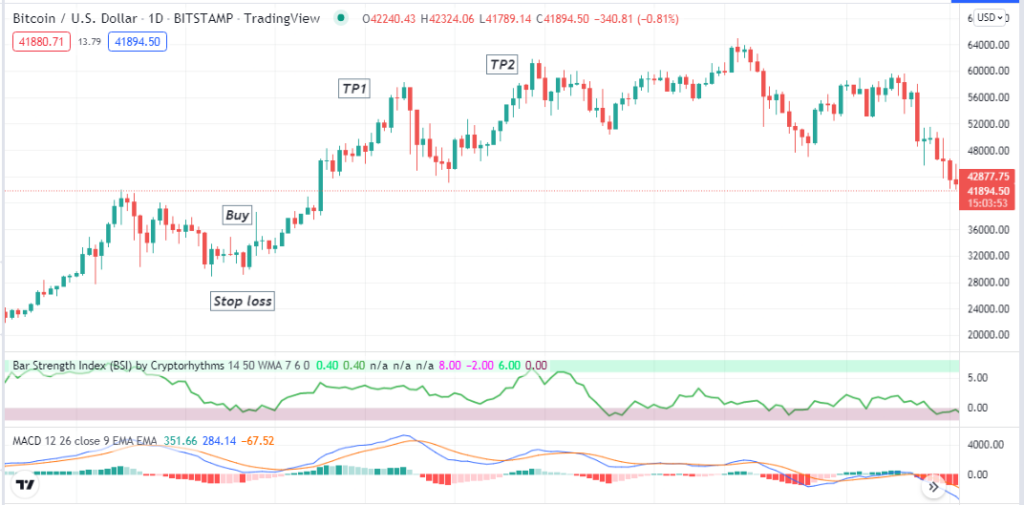
Bullish setup
Entry
Match these conditions above and open a buy position.
Stop loss
Place an initial stop loss below the recent swing low.
Take profit
Close the buy order when-
- The BSI dynamic line starts to drop at the redzone after reaching the greenzone.
- MACD red histogram bars take place below the central line.
- The dynamic blue line drops below the dynamic red line on the MACD indicator window.
Bearish trade scenario
Implement both indicators at your target asset chart and observe when
- The BSI dynamic line remains at or near the lower red zone or starts bouncing upside after getting that level.
- The dynamic blue line crosses the dynamic red line on the downside at the MACD indicator window.
- MACD red histogram bars take place below the central line.
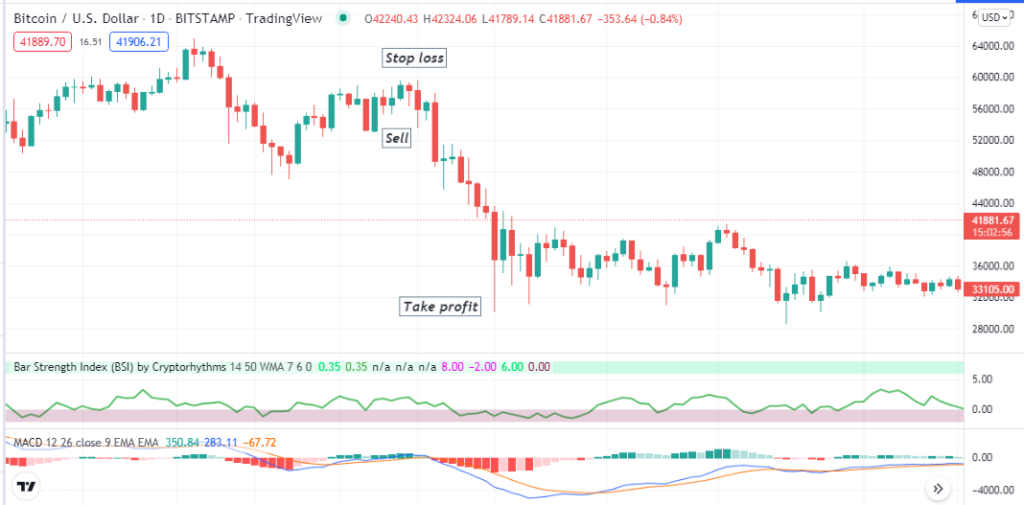
Bearish setup
Entry
Match these conditions above and open a sell position.
Stop loss
Place an initial stop loss above the recent swing high.
Take profit
Close the sell order when-
- The BSI dynamic line starts to drop at the redzone after bounching toward the greenzone.
- MACD green histogram bars take place above the central line.
- The dynamic blue line goes above the dynamic red line on the MACD indicator window.
Pros and cons
| Pros | Cons |
| The BSI indicator works fine on many trading assets. | BSI indicators can fail due to fundamental reasons and in consolidating phases. |
| BSI indicator is an easily applicable indicator. | The BSI indicator doesn’t suggest any exact entry/exit points of trades. |
| BSI indicators can suggest both short-term and long-term trades. | Combining the indicator reading with other indicators requires complete trade setups. |
Final thought
The BSI indicator is one of the most potent hybrid indicators useful for crypto investors. Try some practice to master the concept before entering any trade using this indicator or strategies.