
Financial traders use different trading indicators to make trade decisions. Different indicators use different calculations or formulas to determine market contexts by prioritising various market info. There are often many modifications for indicators to increase effectiveness and accuracy. The Connors RSI is among that group of modified indicators.
However, it requires understanding the new modifications to get the best results by using any trading indicator besides learning the using process. This article will introduce you to the Connors RSI indicator, a complete guideline to execute successful trades using this indicator.
What is the Connors RSI indicator?
The Connors RSI indicator is a technical indicator that identifies the market context depending on three components. Those three components are The RSI, Rate-of-Change, and the Up-Down Length. This indicator combines all these components to interpret the market context and shows reading on an independent window like a traditional RSI indicator. In contrast, perimeters are different for these two. This indicator uses parameters between 0-100. The primary difference between the traditional RSI and Connors RSI is the level to declare the oversold and overbought conditions. The uniqueness is this indicator shows better results to determine short-term trading positions.
The formula this indicator use is:
CRSI(3,2,100) = [ RSI(3) + RSI(UpDown Length,2) + ROC(100) ] / 3
How to trade using the CRSI indicator
It requires understanding the calculation and following specific guidelines to execute successful trades by creating a complete potential trading method through any trading indicator. In this area, we will describe the trading process using the CRSI indicator by following some simple steps as follows:
Step one: Identify the market context
The initial step is to learn the price movement, precisely determining trends. Most successful traders’ goal is to buy the asset near low and sell when the price reaches high. The CRSI involves determining overbought and oversold levels through a dynamic line on an independent window. When the CRSI line reaches below 10, it indicates an oversold condition on asset price, and an uptrend is coming. Conversely, when the CRSI line gets near 90 or above, it declares an overbought condition on asset price, and an upcoming declining pressure is near. Traders use this indicator frequently in lower time frames to identify the best short-term trading positions.
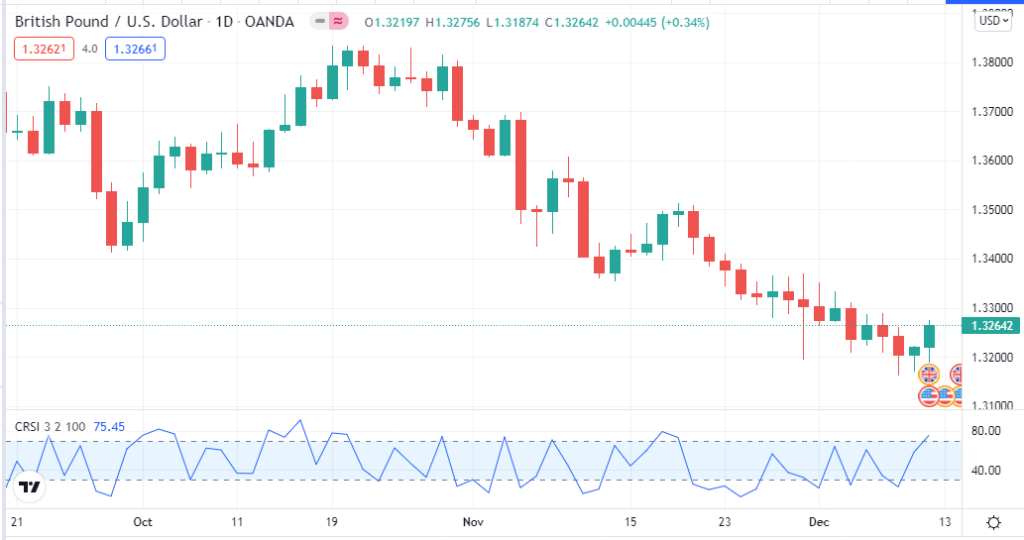
The CRSI indicator on a daily chart of GBP/USD
This indicator often generates false signals, so technical traders frequently combine other indicators to determine trading positions. For example, the CRSI line may reach the overbought level and start signals for an upcoming decline. Meanwhile, the strength of buying pressure may increase or remain the same, so the price continues to the uptrend.
Step two: Try to combine other indicators with CRSI
You already know that this trading indicator may generate false signals. So it is better to use other technical indicators to generate precious trade ideas as professional traders do. It will enable to catch the most potent trades by utilising both performing indicators info. For example, you may use an EMA crossover with the CRSI indicator.
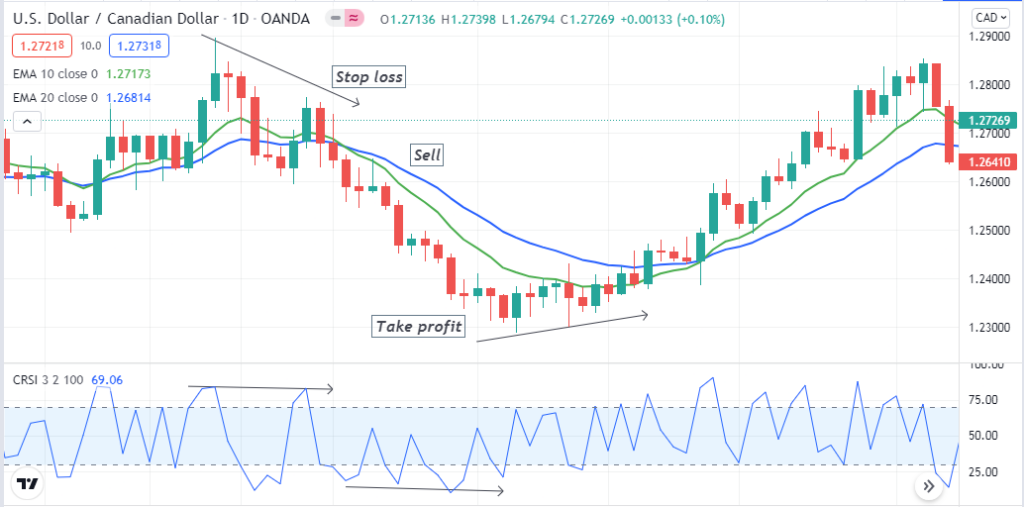
Bearish setup using EMA crossover and the CRSI indicator
Suppose you use EMA 10 (green) and EMA 20 (blue) lines on your chart. The CRSI line reaches the overbought level, and the green EMA line crosses the blue EMA on the downside signals a potential condition to open a sell position. On the other hand, the exact opposite appearance on those indicators generates bullish trade ideas. You can also use candlestick patterns or technical tools to combine with the CRSI indicator to perform in potential trades.
Step three: Move to upper timeframe charts
The timeframe is an essential factor in financial trading. Different trading indicators are suitable for different timeframes. Moreover, traders’ interactions with the asset price or participation also depend on timeframes as various traders’ trade durations are different. For example, a day trader has tendencies to perform all trading activities within a trading day, not allowing an overnight holding.
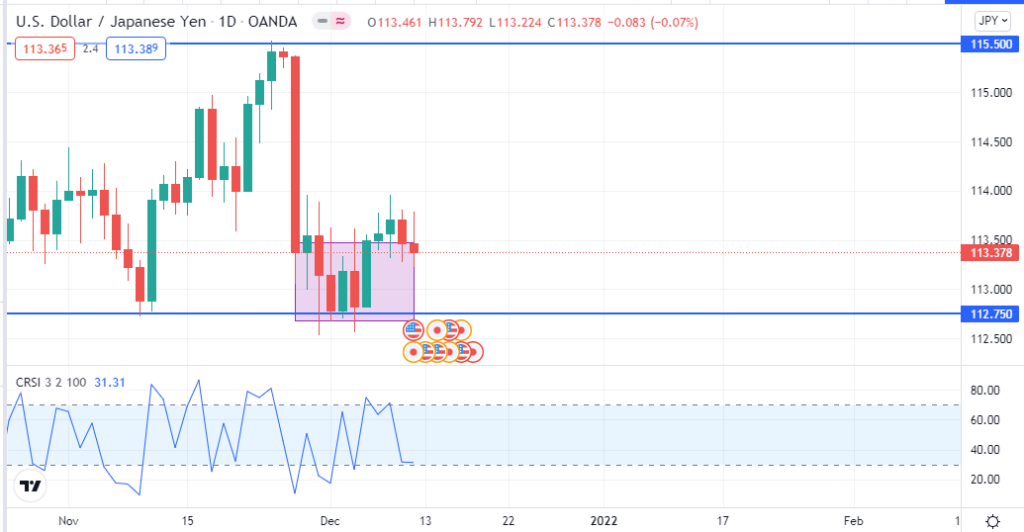
The daily chart of USD/JPY
On the other hand, a position trader allows holding positions for a few days or even weeks. This daily chart of USD/JPY below shows the price remains sideways at a support level near 112.75 for a few days after declining from a peak near 115.50. A long-term trader may seek to open a buy position here and hold for a few days or even weeks.
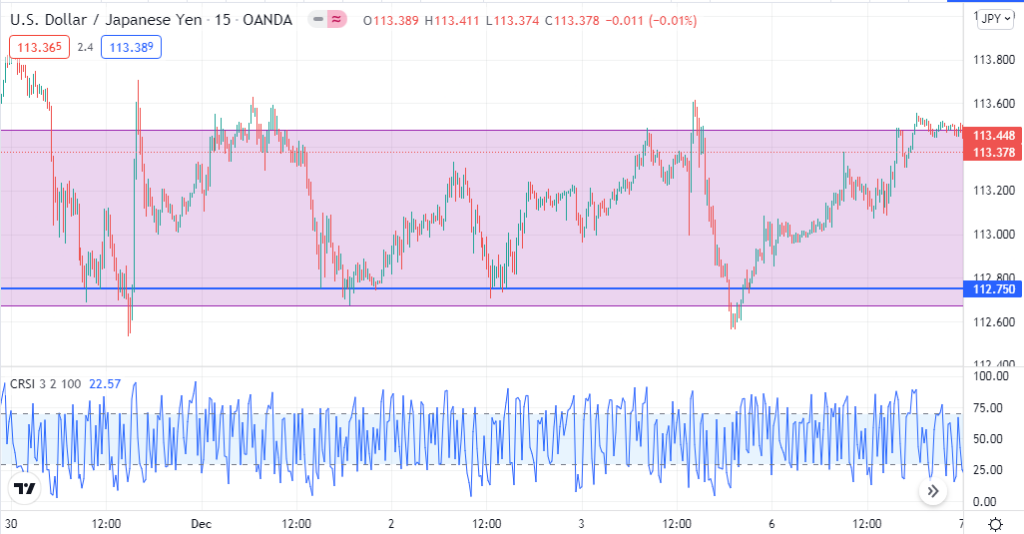
USD/JPY 15-min chart
Meanwhile, a daily trader can frequently participate in a few buy orders as the price reaches many times at support/resistance levels at lower timeframes.
Step four: Use multi-timeframe analysis
You already know that the CRSI indicator is adequate to catch short-term trades. Using a multi-timeframe analysis will enable opportunities to make constant trading positions. For example, when the price reaches the support level on the daily chart of USD/JPY and starts spiking. You can get many buy/sell positions on the consolidating phase when you seek trading positions using a 5-min or 15-min chart through the simple concept of support resistance besides CRSI indicator readings.
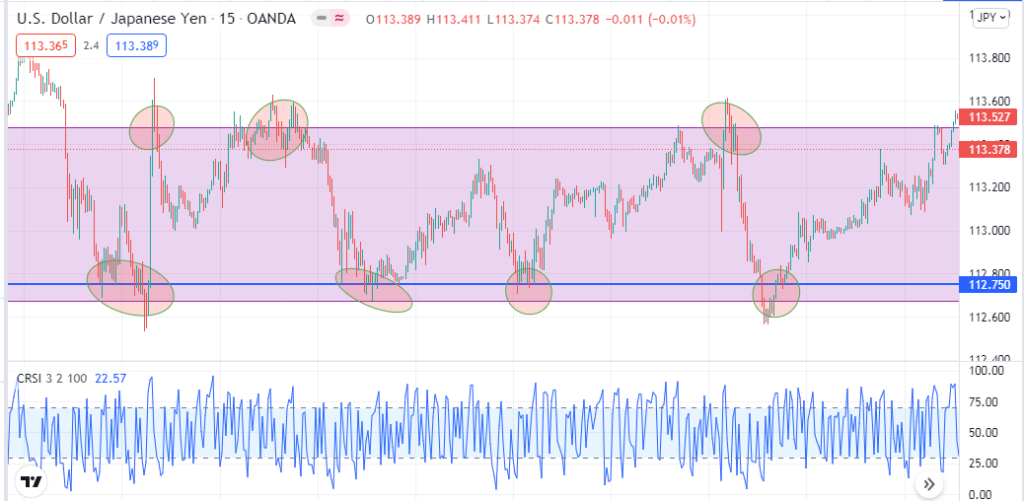
Price reactions on support resistance level
Moreover, conducting multi-timeframe analysis enables a birds-eye view of the asset price. So you can avoid risky trades by opening positions against the trend or performing against the institutes and increasing profitability. It also relates the trade durations for any executing trade.
Step five: Try to combine fundamental data
Financial investors make investment decisions depending on any trading instrument’s technical and fundamental contexts. Technical indicators often fail to predict the future movements of trading assets due to fundamental events. For example, any interest rate decision by the Federal Reserve or the European Central Bank can cause 100-250 pips movement on the EUR/USD pair within a day! Many remarkable fundamental events for any currency pair are GDP, employment data, economic policies, pandemics, etc.
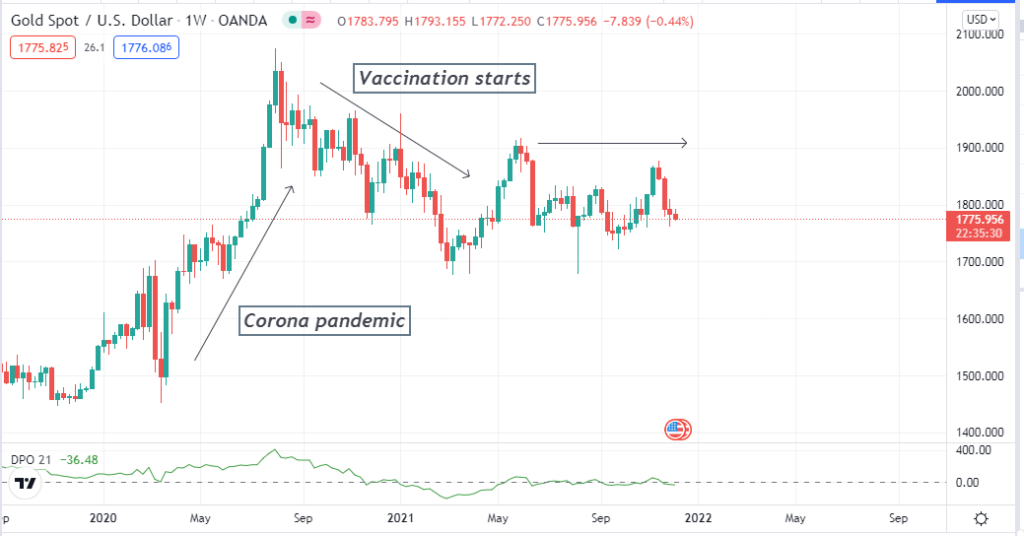
Pandemic impact on XAU/USD
Final thought
Finally, this article describes all primary facts of the CRSI indicator besides complete guidelines to trade with this unique oscillator indicator. You can use many trading indicators and tools with this indicator: support resistance, Fibonacci retracement, MACD, Parabolic SAR, ADX, etc. Additionally, make trade decisions through complete trading methods that follow acceptable trade and money management rules.