

What is the Elder Impulse system in the crypto market? Let’s have a look at the complete leder impulse trading guide with practical example. The Elder Impulse System is a powerful approach to the marketplace that combines two different technical indicator readings to generate trade ideas. This concept is capable of generating constantly profitable trade ideas when applied efficiently. Therefore, the Elder Impulse System has become attractive to crypto investors.
i Key Trading Takeaways
- Dual-Indicator Harmony: Combines a 13-period EMA (to assess trend direction) with the MACD Histogram (to measure momentum slope).
- Three Distinct States: Green bars indicate bullish alignment (long only), red bars signal bearish dominance (short only), and blue bars signify neutral conditions.
- Strict Execution Rules: Prohibits buying on red bars or selling short on green bars, systematically preventing counter-trend trading traps.
However, when expecting to execute successful trades using any technical indicator or tool, it is mandatory to have clear concepts and components alongside applying them correctly. This article will introduce you to the Elder Impulse System Strategy and explains sustainable trading strategies using this concept with chart attachments for better understanding.


What is the Elder Impulse System Strategy?
The elder impulse system strategy helps determine trend continuation of reversal by combining two different familiar technical indicator concepts. Alexander Elder is the designer of this trading method, and he describes this technique first in his book “Come Into My Trading Room.”
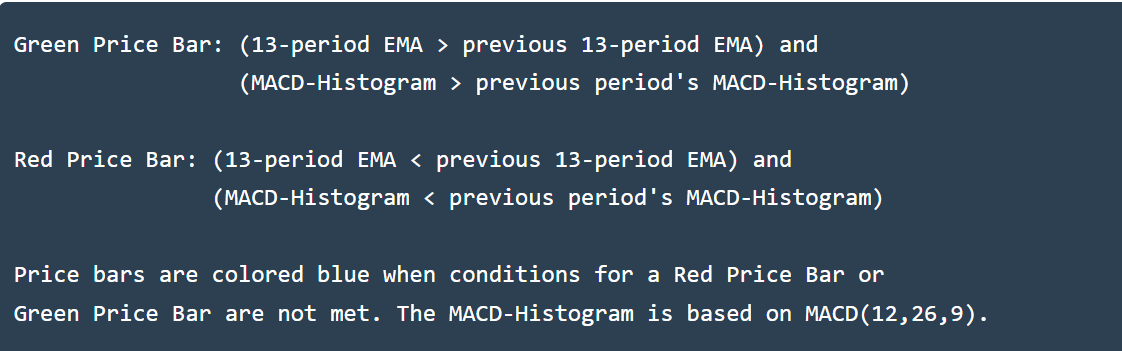
The author combines 13-Day EMA and the Moving Average Convergence Divergence (MACD) to detect entry/exit points of trades. The idea is to identify tradable impulses using these two momentum and trend-following technical indicators.
How to trade using the Elder Impulse System Strategy?
The EIS system combines different indicator concepts and changes the colors of price candles according to the market context. In some cases, many experts use this concept to determine market conditions in an independent window. When it creates a series of green candles or green histogram bars, it declares a positive force on the asset price, and red candles or histogram bars indicate the price is facing a declining pressure. Meanwhile, the blue color represents neither bullish nor bearish momentum and instead reflects indecision or confusion among participants.
Short-term trading strategy
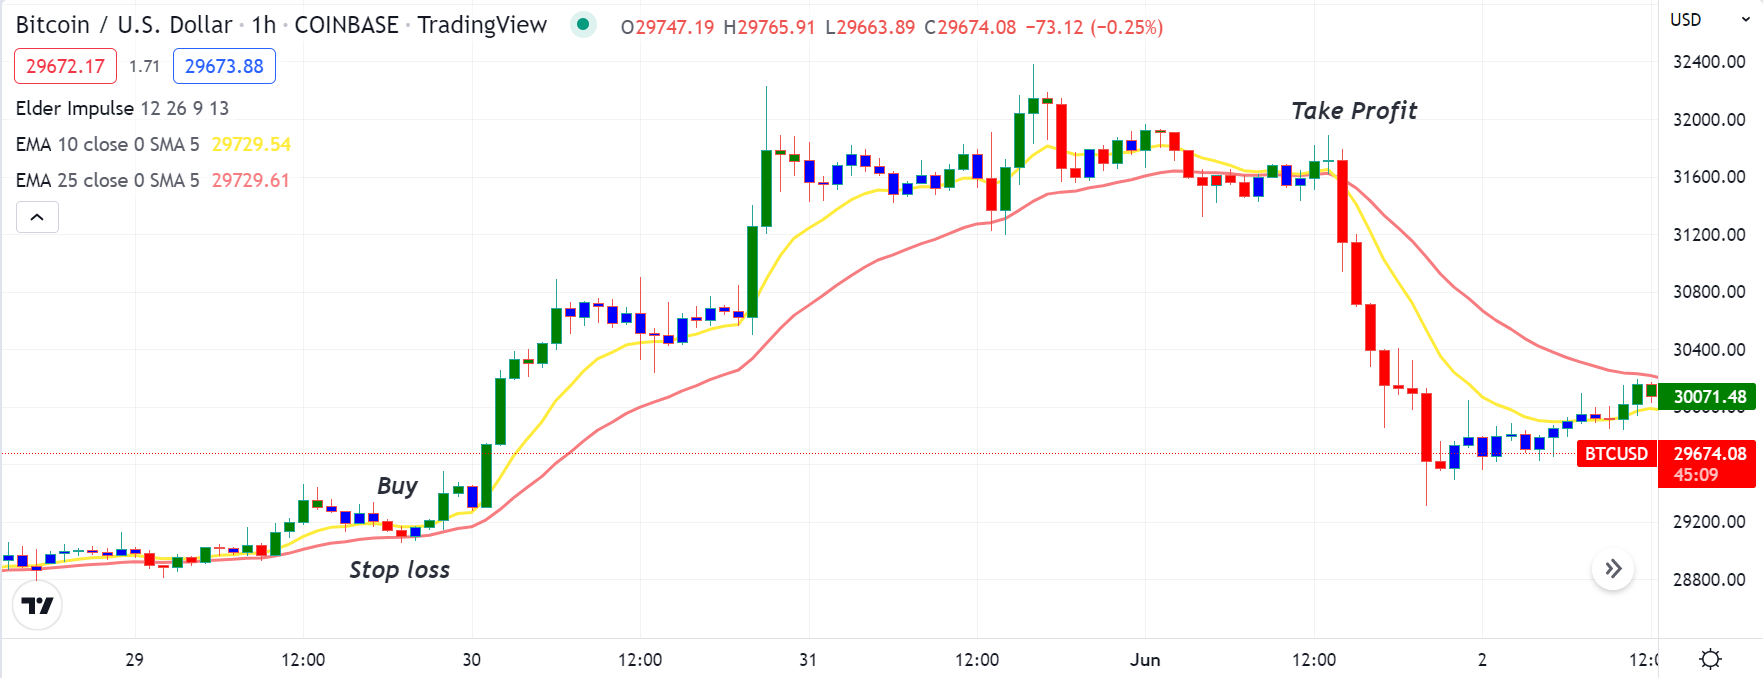
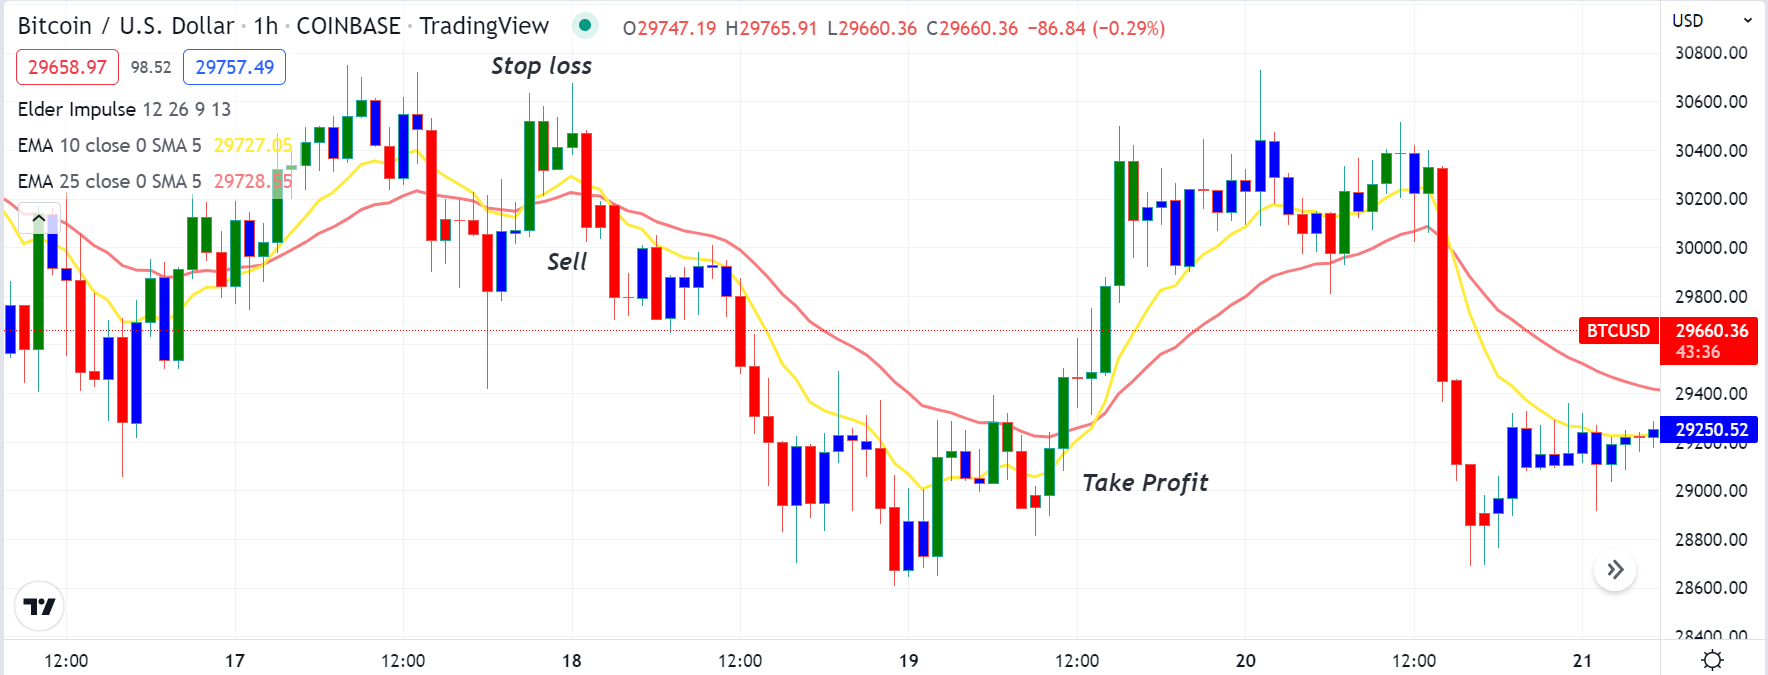
We use the EMA crossover concept alongside the Elder Impulse System to execute efficient trades in this trading method. This method contains two EMA lines: EMA 10 (yellow) and EMA 25 (pink). The idea is to detect potential impulse through the EIS indicator and confirm the price direction through crossover between the EMA lines. You can apply this method to many trading instruments at different time frame charts; we prefer using a 15-min of Hourly charts to catch the most potent short-term trades.
Bullish trade scenario
Apply all indicators at your target asset chart and seek opening buy positions after matching conditions below:
- The price reaches a support level and starts bouncing back on the upside.
- The EIS indicator starts creating green candles.
- The yellow EMA line crosses above the pink EMA line.
Entry
When these conditions above match your chart, it declares a potential bullish momentum. Open a buy order.
Stop loss
Set an initial stop loss below the current swing low with a 5-10pips buffer.
Take profit
Close the buy position when the scenarios below occur:
- Price candles turn red or blue.
- The price gets below both EMA lines.
- The yellow EMA line drops below the pink EMA line, and both EMA lines head on the downside.
Bearish trade scenario
Apply all indicators at your target asset chart and seek opening sell positions after matching conditions below:
- The price reaches a resistance level and starts dropping on the downside.
- The EIS indicator starts creating red candles.
- The yellow EMA line crosses below the pink EMA line.
Entry
When these conditions above match your chart, it declares a potential bearish momentum. Open a sell order.
Stop loss
Set an initial stop loss above the current swing high with a 5-10pips buffer.
Take profit
Close the sell position when the scenarios below occur:
- Price candles turn green or blue.
- The price gets above both EMA lines.
- The yellow EMA line reaches above the pink EMA line, and both EMA lines head on the upside.
Long-term trading strategy
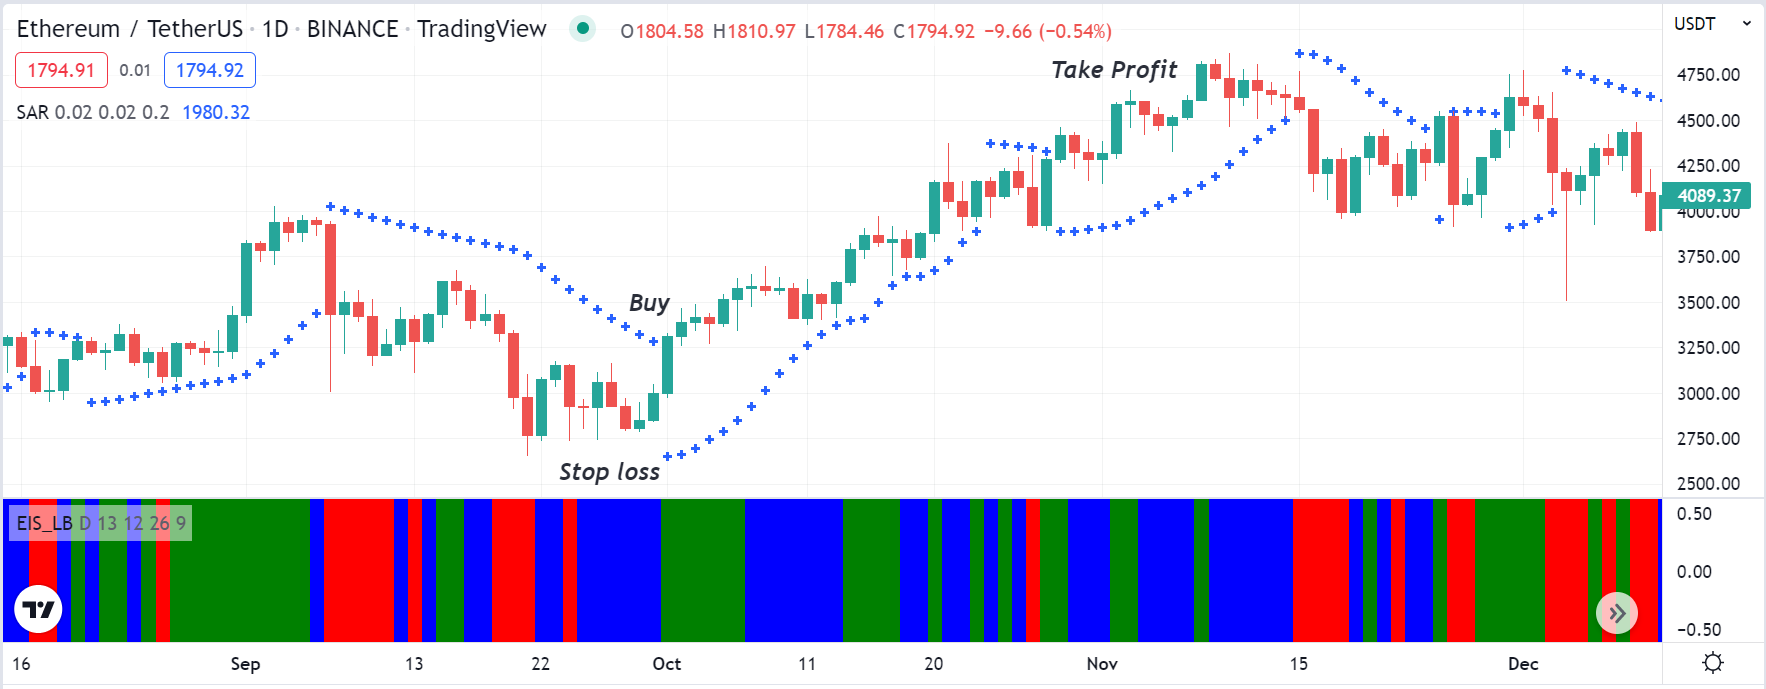
This trading method uses the Parabolic SAR as a supportive technical tool alongside the EIS indicator. The idea is to determine the trend-switching or reversal points through the Parabolic SAR indicator and make trade decisions according to the EIS indicator reading. So it becomes easier and enables identifying efficient entry/exit points of trades. Apply this method on an H4 or D1 chart to get the best results while seeking to participate in long-term trades.
Bullish trade scenario
Apply both indicators to your target asset chart and seek to open buy orders when the scenarios below occur:
- The EIS indicator window creates green histogram bars.
- The parabolic SAR dot takes place below price candles and starts making a series.
Entry
These conditions above declare a positive force on the asset price, or the price may enter a bullish momentum. Open a buy position.
Stop loss
The initial stop loss will be below the current bullish momentum.
Take profit
You can continue your buy order until the price remains in the current uptrend or ignore the blue histogram bars of the EIS indicator window. Close the position by checking the conditions below:
- Red histogram bars take place at the EIS indicator window.
- The parabolic SAR dots flip on the upside of price candles.
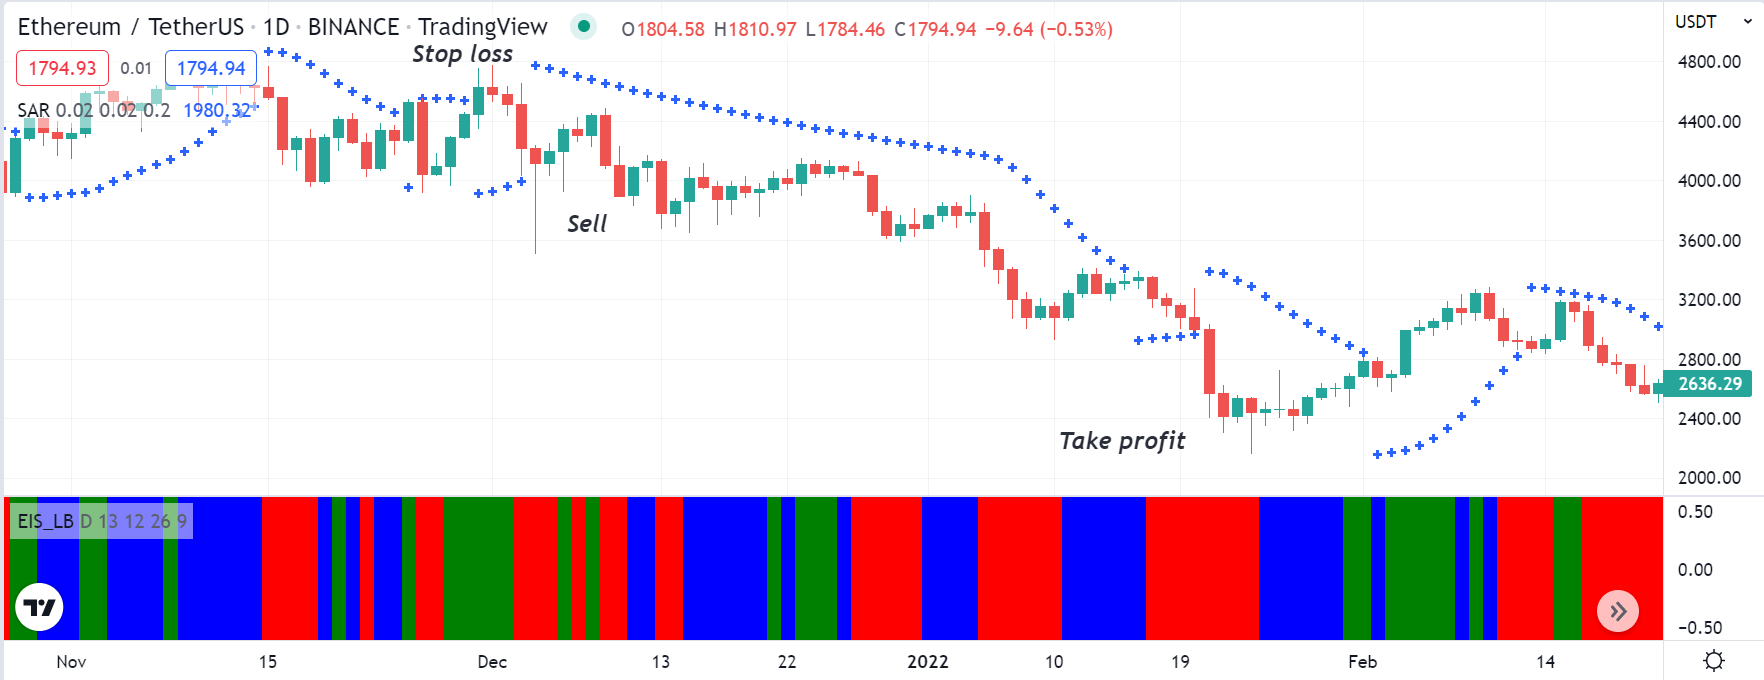
Bearish trade scenario
Apply both indicators to your target asset chart and seek to open sell orders when the scenarios below occur:
- The EIS indicator window creates red histogram bars.
- The parabolic SAR dot takes place above price candles and starts making a series.
Entry
These conditions above declare a declining force on the asset price, or the price may enter a bearish momentum. Open a sell position.
Stop loss
The initial stop loss will be above the current bearish momentum.
Take profit
You can continue your sell order until the price remains in the current downtrend or ignore the blue histogram bars of the EIS indicator window. Close the position by checking the conditions below:
- Green histogram bars take place at the EIS indicator window.
- The parabolic SAR dots flip on the downside of price candles.
Pros and cons
Pros
Cons
- The EIS strategy combines two different indicator concepts and suggests efficient trades.
- It requires a particular level of understanding while using the EIS concept for trading.
- You can apply this concept to many trading instruments.
- It only relies on technical market info.
- It is an easily applicable method.
- This concept can fail due to fundamental reasons.
Final thought
Finally, this article introduces you to a most potent technical concept, the Elder Impulse System Strategy, to make money consistently. We suggest mastering the concept with sufficient practice before applying it to trade.













