

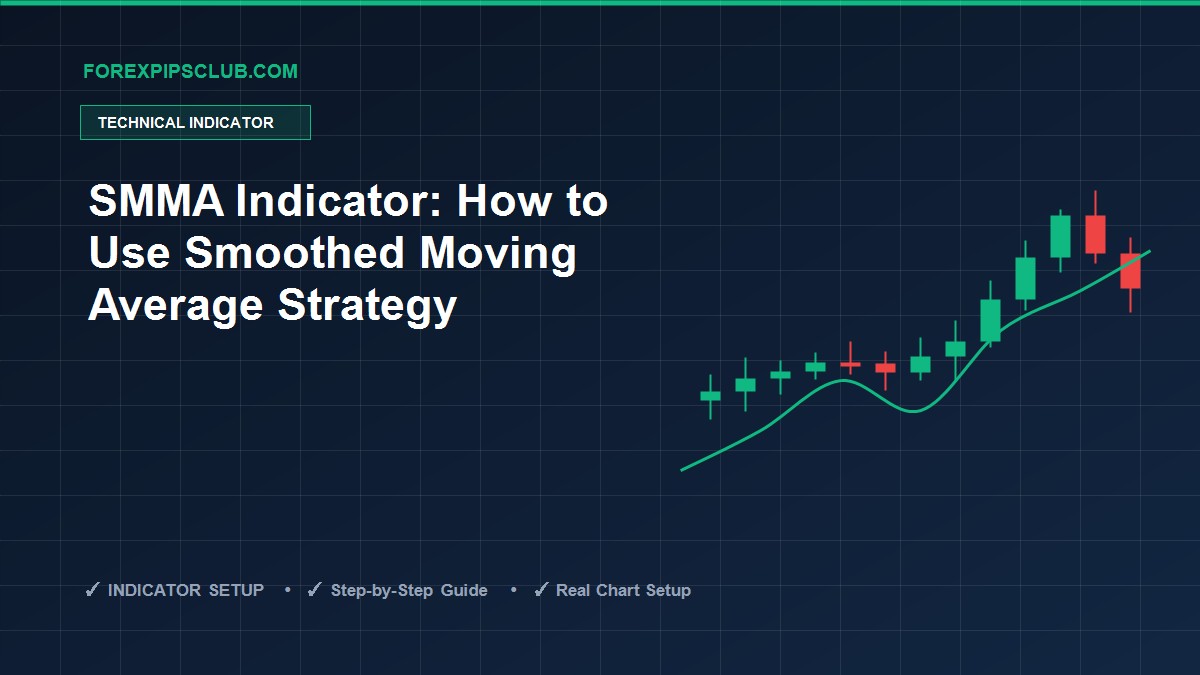
There are many trading indicators available in financial trading. Many use the same concept but different formulas to obtain more accurate results. The Smoothed Moving Average (SMMA) is one of the remarkable ones.
However, you need to learn the components and calculation of any specific moving average before declaring it the best. This article introduces the SMMA and describes trading techniques, then lists the top pros and cons.


What is the Smoothed Moving Average (SMMA)?
The SMMA is a version of the SMA that reduces noise to represent market data more smoothly. It reduces price fluctuations by averaging price values over a particular period. The calculation differs slightly from the SMA: the SMMA takes all historical data into account while removing short-term market fluctuations, showing the prevailing trend to traders.
The calculation can be complicated, but you don’t have to do it manually, as most trading platforms provide the indicator by default. The commonly used formula is:
SMMA(i) = (SUM − SMMA(i−1) + CLOSE(i)) / N
where SUM is the sum of closing prices over N periods and N is the number of periods.
How to use SMMA in a trading strategy
The SMMA is a straightforward technical indicator. You can use it on any trading instrument, including currency pairs, stocks, commodities and indices. Like other moving averages, you can use it to determine support and resistance levels, trends, bullish or bearish momentum and sideways markets. You can build trend-following strategies with it that suggest opening a buy position when the price rises or a sell position when the price is declining.
You can use the SMMA as a standalone indicator or combine it with other technical tools and indicators. For example, you can use the Parabolic SAR alongside SMMA 50. When the price moves above the SMMA line and the Parabolic SAR dots appear below price candles, it signals the price is in an uptrend.
A short-term trading strategy
In this method we use an SMMA crossover of two different periods: SMMA 10 is a red line and SMMA 20 is a green line. It suits any trading instrument and any timeframe. We recommend a 15-minute or H1 chart to catch the most promising short-term trades.
Bullish trade scenario
When seeking to open a buy position, observe:
- The red SMMA line crosses above the green SMMA line.
- Both SMMA lines are heading upward.
Entry
When these conditions match your target asset chart, the price is entering bullish momentum. Open a buy position.
Stop loss
Place a reasonable stop loss below the bullish momentum with a buffer of 10-15 pips.
Take profit
This strategy usually suggests trades with a risk-reward ratio of at least 1:2. Close the buy position when the bullish momentum ends or the red SMMA line crosses below the green SMMA line.
Bearish trade scenario
When seeking to open a sell position, observe:
- The red SMMA line crosses below the green SMMA line.
- Both SMMA lines are heading downward.
Entry
When these conditions match your target asset chart, the price is entering bearish momentum. Open a sell position.
Stop loss
Place a reasonable stop loss above the bearish momentum with a buffer of 10-15 pips.
Take profit
This strategy usually suggests trades with a risk-reward ratio of at least 1:2. Close the sell position when the bearish momentum ends or the red SMMA line crosses above the green SMMA line.
A long-term trading strategy
We use the SMMA alongside the RSI indicator in this long-term method, with an SMMA of 21 periods. It suits any trading instrument and allows holding positions for days or even weeks. The recommended timeframe is the D1 chart.
Bullish trade scenario
Look to open a buy position when:
- The price moves above the SMMA line.
- The RSI line is near or above the central (50) level, heading upward.
Entry
When these conditions match, sufficient bullish pressure is on the asset price. Place a buy order.
Stop loss
The initial stop loss goes below the current swing low.
Take profit
Observe the price movement and close the buy position when:
- The price falls below the SMMA line.
- The RSI line reaches the overbought level or starts to decline toward the central (50) line after reaching that level.
Bearish trade scenario
Look to open a sell position when:
- The price moves below the SMMA line.
- The RSI line is near or below the central (50) level, heading downward.
Entry
When these conditions match, sufficient bearish pressure is on the asset price. Place a sell order.
Stop loss
The initial stop loss goes above the current swing high.
Take profit
Observe the price movement and close the sell position when:
- The price rises above the SMMA line.
- The RSI line reaches the oversold level or starts to rise toward the central (50) line after reaching that level.
Pros and cons
| Pros | Cons |
|---|---|
| The indicator suits many trading assets. | It can fail due to fundamental reasons. |
| It allows both short-term and long-term trading positions. | It often overlooks the complex relationships in market data. |
| It is easy to apply and reduces more noise than the SMA. | It doesn’t respond to price fluctuations from other causes such as seasonal impacts or cycles. |
Final thought
The SMMA is a useful indicator for building trading positions. We recommend practicing these strategies on a demo account to master the concept before applying them to a live account.













