
The AscTrend Trading System For MT4 is based on multiple custom indicators to define the market direction from multiple angles. In the following section, we will see the description of each trading indicator used in this system with a bullish and bearish trading strategy.
Tools For The AscTrend Trading System
Before proceeding to how this strategy works we will see the list of indicators used in this trading method, including a short description. Therefore, we can define the use and effectiveness of every tool to get a better trading result.
List of indicators used in this system:
- ASCTrend
- NRTR Line
- WPR
Before moving to the description of these tools, we will see the visual representation of these indicators.

ASCTrend
ASCTrend2 is shown with some dots above or below the price indicating the medium-term market sentiment.
We can define the market sentiment with this indicator based on the below-mentioned rules:
- If the ASCTrend2 is below the price and moving up, the overall market sentiment is bullish.
- If the ASCTrend2 is above the price and moving downside, the overall market sentiment is bearish.
- When the ASCTrend2 is flat, the market sentiment is corrective, and there is no specific trend in the price.
- This indicator has a bullish and bearish arrow to indicate the upcoming market direction.
On the other hand, the ASCTrend is like the Heiken Ashi Candles, close to the current market price.
NRTR Line
NRTR Line is a dynamic line, very close to the price. It indicates the market sentiment by appearing below or above the current market price.
The Magenta Color represents bearish sentiment, and the Aqua color represents bullish sentiment.
On the other hand, the NRTR Color line works as upper bands and lower bands. When the price reaches the Red and Blue NRTR Color line, it may face minor support or resistance. Moreover, breaking above or below these levels indicates a shart movement.
WPR
This indicator is shown with some vertical lines in two separate windows- WPR Slow and WPR Fast.
WPR Slow and WPR Fast work in the same way but WPR Fast provides more frequent results than WPR Slow.
However, we are interested in the price action, where both of these indicators show the same signal.
The AscTrend Trading System For MT4
The AscTrend Trading method focuses on the current market trend, where we will follow the price direction from a minor correction.
This trading strategy is suitable for any timeframes from 1 minute or above. Therefore, it can cover trading needs from all types of traders.
Moreover, this method has built-in money management and trade management rules that can increase the trading probability. However, you should ensure the same price direction from all indicators to get the best result.
Bullish AscTrend Trading Method
The bullish trading strategy is suitable for all financial instruments, but you have to consider unavoidable risks before taking the trading decision.
Therefore, it is better to stick to major currency pairs as exotic pairs have a higher trading cost.
Moreover, this trading method does not have any timeframe limit. Therefore, you can consider it as both a scalping and swing trading method.
Conditions
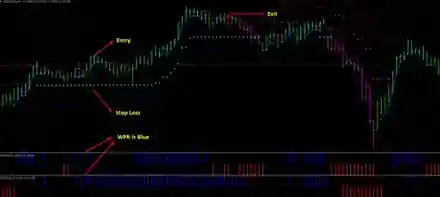
- The primary bullish indication is that the price is moving up and currently trading above the blue NRTR Color line.
- The NRTR color changes from Magenta to Green.
- NRTR Buy arrow appeared below the price.
- WPR Fast and WPR Slow show the same color (Blue).
Entry
If you find the price with all these conditions, you should wait for a candle to close. The closing candle should be bullish, and you should enter on the next candle.
Make sure to use an appropriate lot size based on the trading balance and accuracy.
Stop Loss
After taking the trade, the sentiment is expected to continue as long as the price is above the NRTR Blue line. Therefore, the stop loss should be below the NRTR Blue line as a conservative approach. Otherwise, you can get out of the trade if it moves below the ASC Trend dots.
Take Profit
The price may follow the bullish direction as long as it is making a higher high. Later on, you can close the trade after a red NRTR appears above the price.
Moreover, you can use recent important horizontal levels to define the take profit level.
Bearish AscTrend Trading Method
You can apply the bearish strategy in all currency pairs, but it is better to stick to major currency pairs as exotic pairs have a higher trading cost.
Moreover, this trading method does not have any timeframe limit. Therefore, you can consider it as both a scalping and swing trading method.
Overall, the bullish and bearish strategy follows the same trading rules but in the opposite direction.
Conditions
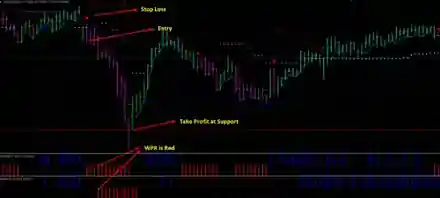
- The primary bearish indication is that the price is moving down and currently trading below the Red NRTR Color line.
- The NRTR color changes from Green to Magenta.
- NRTR Sell arrow appeared above the price.
- WPR Fast and WPR Slow show the same color (Red).
Entry
If you find the price with all these conditions, you should wait for a candle to close. The closing candle should be bearish, and you should enter on the next candle.
Make sure to use an appropriate lot size based on the trading balance and accuracy.
Stop Loss
After taking the trade, the sentiment is expected to continue as long as the price is below the NRTR Redline.
Therefore, the stop loss should be above the NRTR Redline as a conservative approach. Otherwise, you can get out of the trade if it moves above the ASC Trend dots.
Take Profit
The price may follow the bearish direction as long as it is making a lower low. Later on, you can close the trade after a blue NRTR appears in the price.
Moreover, you can use recent important horizontal levels to define the take profit level.
Summary
Let’s summarise The AscTrend Trading System For MT4:
- The AscTrend Trading System For MT4 is based on multiple custom indicators.
- While taking trading decisions, you should ensure the same price direction from all indicators.
- This trading strategy is applicable in any currency pairs on any timeframe.
- A bullish candle is important for a buy trade, and a bearish candle is important for a sell trade.
- The stop loss is based on the NRTR line and the Horizontal level.