The Bollinger Bands and SVE Bollinger Bands Trading System for MT4 is a profitable trend pullback/reversal trading strategy that can generate a decent outcome from an ongoing market bias. This strategy is mainly focused on small retracements that happen while the market is trending in one direction. Additionally, we will be going to utilize two types of Bollinger Bands indicators set-up to increase the trading probabilities. Along with this, we will also focus on the market price action context.
📌 Strategy Summary & Key Parameters
- Strategy Name: The Bollinger Bands and SVE Bollinger Bands Trading System For MT4
- Platform: MetaTrader 4 (MT4)
- Trading Style: Trend Following & Momentum Breakout
- Recommended Timeframes: M15, H1, H4, Daily
- Recommended Asset Classes: Major & Cross Currency Pairs (EUR/USD, GBP/USD, USD/JPY, EUR/JPY, GBP/JPY)
- Core Technical Tools: MetaTrader 4 Technical Indicators
- Risk Management: 1% to 2% risk per trade with 1:1.5+ Risk-Reward Ratio
What Are Bollinger Bands?
Bollinger Bands are a sort of technical indicator that has widely used in various markets, such as stocks, futures, and currencies. In the 1980s, Bollinger Bands were developed by John Bollinger, which granted exceptional insights between price and volatility. Along with this, you can use Bollinger Bands to identify the overbought and oversold levels, which may help you as a trend following instrument and also finding breakouts.

Key Notes
- Bollinger Bands indicator can help to find entry and exit points.
- Bollinger Bands often show overbought and oversold situations of the market.
- Both professional and retail traders widely use Bollinger Bands.
- Only using the Bollinger Bands is a little bit risky because of its focus on price and volatility.
Calculation of the Bollinger Bands
To assess the SMA (Simple Moving Average) of the security is referred to, commonly utilizing a 20-day SMA. It is the initial phase in calculating the Bollinger bands. As the first data point, a 20-day moving average would be averaging out the closing prices for the initial 20 days. The following data point would drop the foremost price, add the price on day 21 and take the average, etc. The standard deviation of the security's price will be gotten after that. Standard deviation is a numerical estimation of average features and differences that conspicuously in finance, economics, statistics, and accounting.
Bollinger Bands and SVE Bollinger Bands Trading System for MT4
As a trend pullback/reversal strategy, first, we have to identify the primary trend on the higher timeframe to get higher accuracy. However, the forex market is full of unpredictability. An analyst can predict the market by 70% to – 80%. That’s why the only way to hold down in the market is to develop a high accuracy trading system by using multiple indicators.
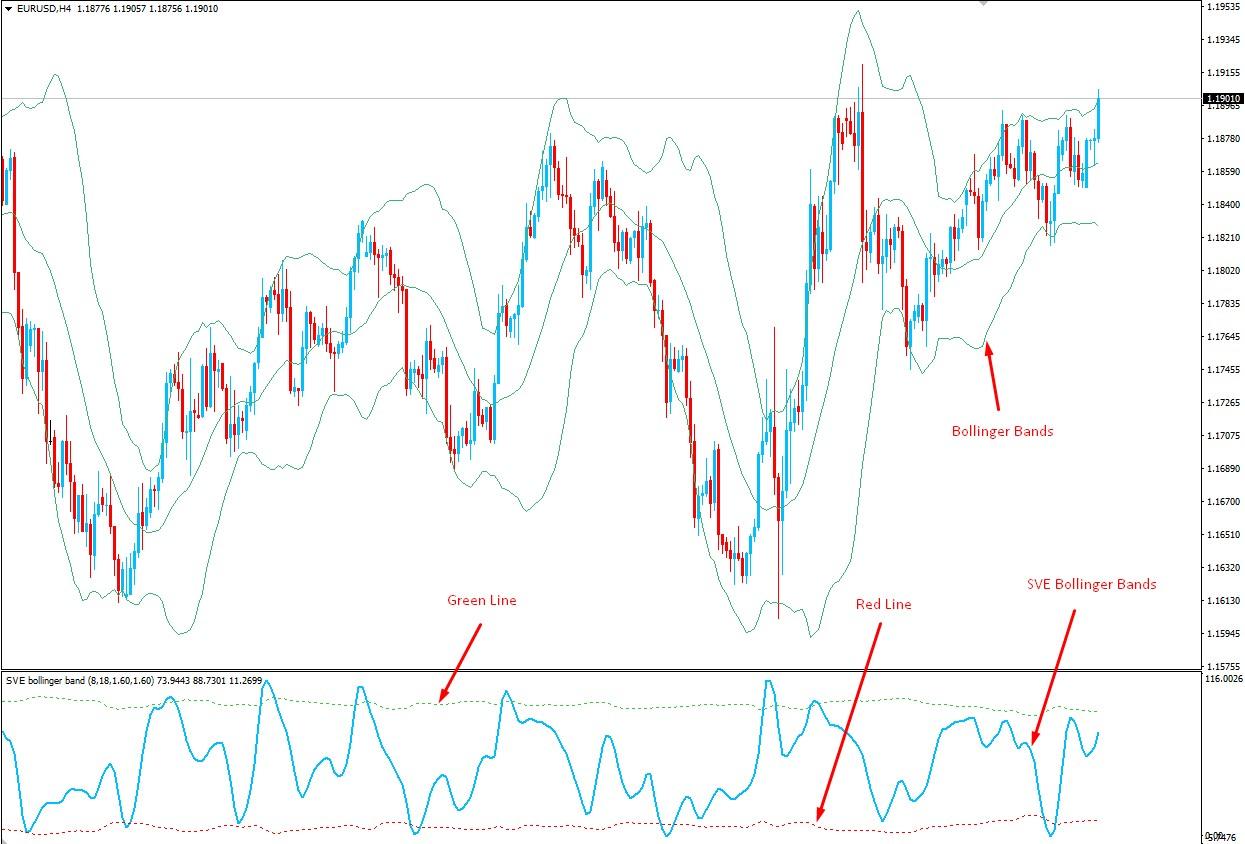
Let’s have a look at trading indicators for the Bollinger Bands and SVE Bollinger Bands Trading System for MT4:
- Bollinger Bands (20, 2)
- SVE Bollinger Bands (set default)
SVE Bollinger Bands
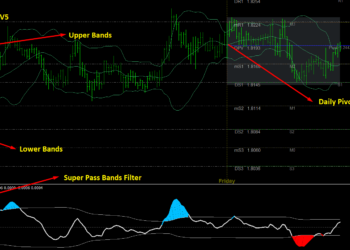
The SVE Bollinger Bands are a trading indicator that provides buy and sell signals depending on ultimate Bollinger Bands values. You can use this indicator on your MT4 trading terminal. Moreover, you can see its signals in a separate MT4 window. In addition, when the SVE Bollinger Bands line crosses back above the 0.00 level, it indicates a buy signal. In contrast, when the SVE Bollinger Bands line crosses back below the 117 level from above, it indicates a sell signal.
Let’s have a look at the visual illustration of these indicators:
Bullish Trading Strategy
The Bollinger Bands and SVE Bollinger Bands Trading System for MT4 is appropriate on all timeframes from 5 minutes to daily. However, the 1 hour and 4 hours give high outcomes as they extract the short-term impacts of the fundamental events.
However, you can trade on any currency pairs you wish, such as GBPUSD, GBPCAD, GBPNZD, EURJPY, GBPJPY, USDJPY, EURUSD, EURCAD, EURNZD, etc.
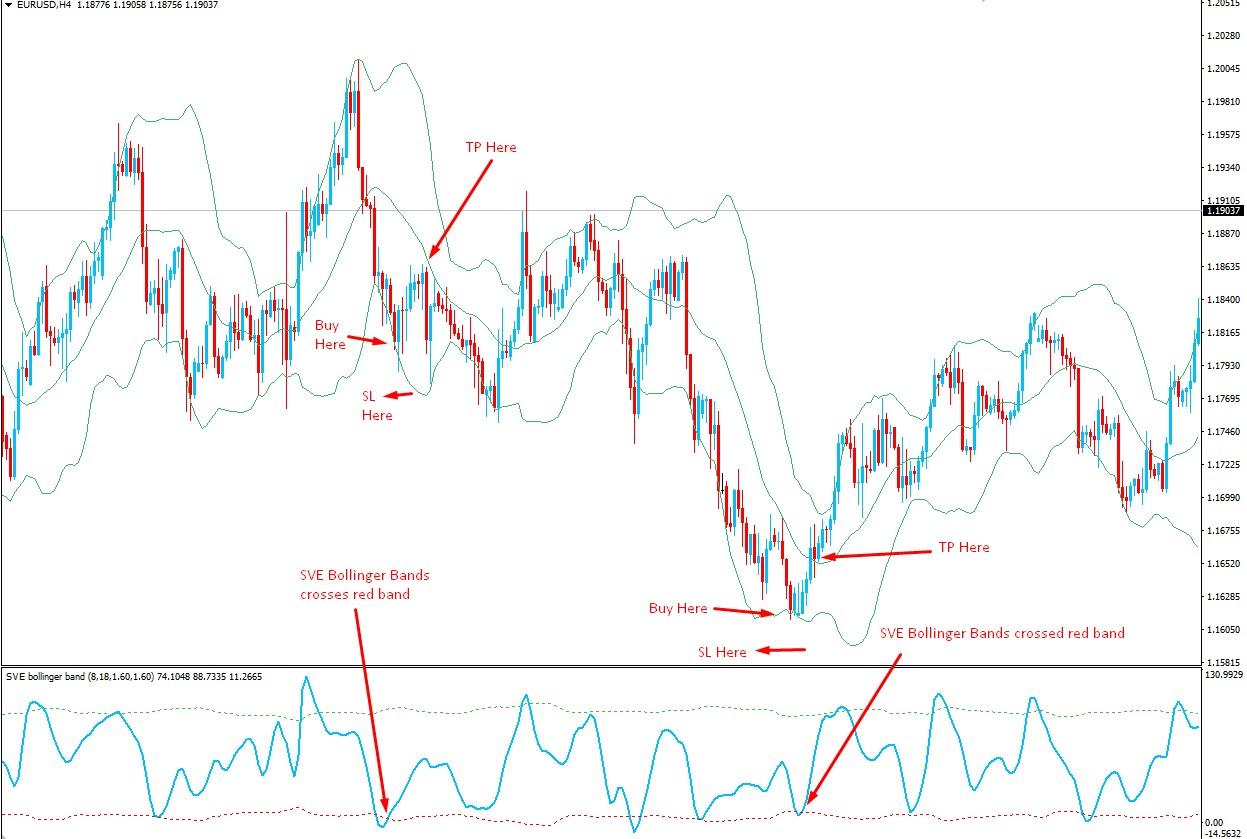
Bullish Trading Conditions
- The price is trending down in the 4-hour timeframe.
- Wait for the price to hit the lower band and close above it.
- SVE Bollinger Bands crossed from bottom to Top Red Band.
Entry
After confirming all the trading conditions, you should wait for the candle to close and execute the buy trade as soon as the candles close. Do not enter before closing the candle because it may impact your capital if the trade goes against you.
Stop Loss
The stop loss should be below the Bollinger Bands lower band with 10 – 15 pips buffer in the H4 timeframe and 5 – 10 pips buffer on the H1 timeframe.
Take Profit
The ideal take profit level is based on a 1:1.5 or 1:2 risk: reward ratio. Therefore, if your stop-loss is 20 pips, you should set the take profit at 40 pips. Alternatively, you can take the profit when the price hits the Bollinger Bands middle band.
Bearish Trading Strategy
The bearish trading strategy is also applicable to all timeframes from the 5 minutes to daily, where the 1 hour and 4 hours give high outcomes as they extract the short-term impacts of the fundamental events.
However, you can trade on any currency pairs you wish, such as GBPUSD, GBPCAD, GBPNZD, EURJPY, GBPJPY, USDJPY, EURUSD, EURCAD, EURNZD, etc.
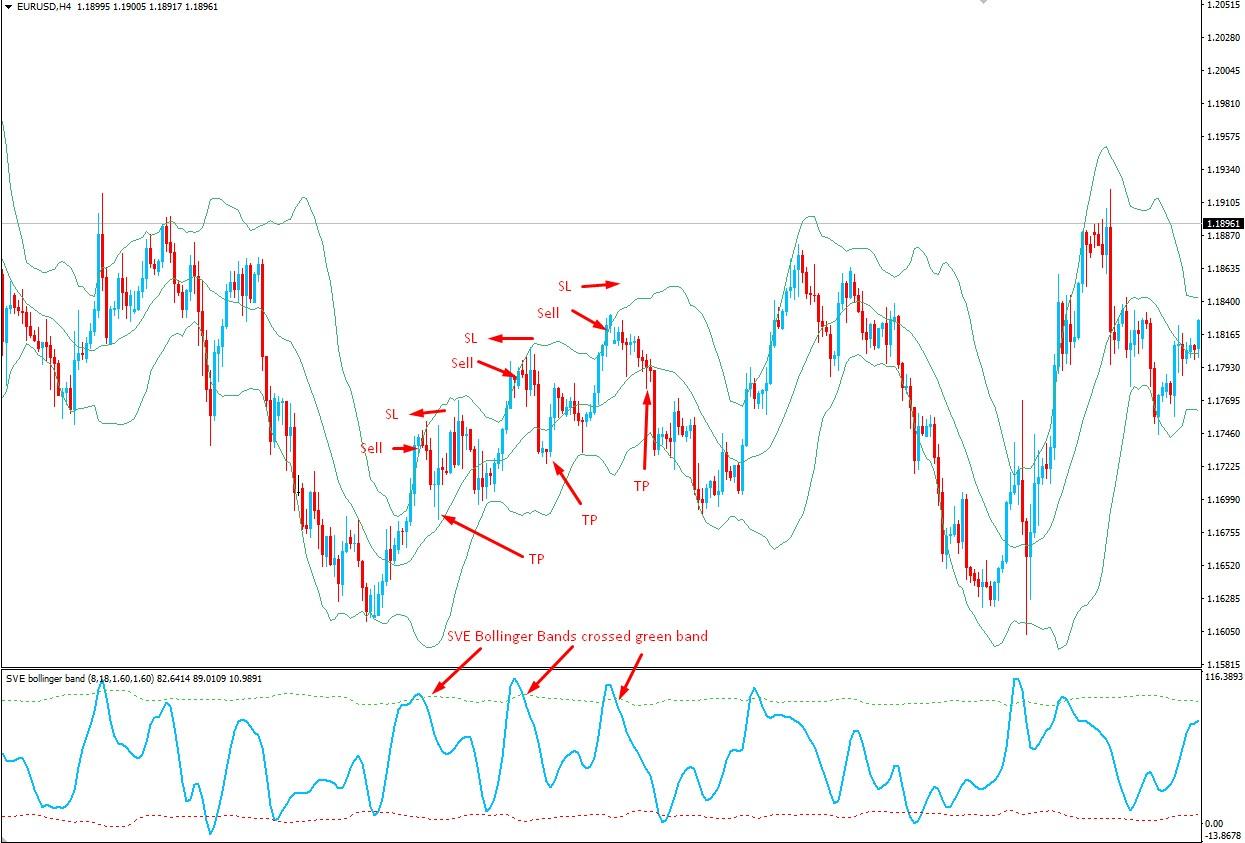
Bearish Trading Conditions
- The price is trending upside in the 4-hour timeframe.
- Wait for the price to hit the upper band and close below it.
- SVE Bollinger Bands crossed from top to bottom Green Band.
Entry
After confirming all the trading conditions, you should wait for the candle to close and execute the sell trade as soon as the candles close. Do not enter before closing the candle because it may impact your capital if the trade goes against you.
Stop Loss
The stop loss should be above the Bollinger Bands’ upper band with 10 – 15 pips buffer in the H4 timeframe and 5 – 10 pips buffer on the H1 timeframe.
Take Profit
The ideal take profit level is based on a 1:1.5 or 1:2 risk: reward ratio. Therefore, if your stop-loss is 20 pips, you should set the take profit at 40 pips. Alternatively, you can take the profit when the price hits the Bollinger Bands middle band.
Conclusion
The Bollinger Bands and SVE Bollinger Bands Trading System for MT4 is the most profitable trading method because it depends on highly accurate indicators. Therefore, you can achieve great trading results at the end of the month. However, in forex trading, there is nothing 100% guaranteed profit in each trade. Therefore, to achieve a better outcome from this trading strategy, you should utilize the proper money management system and better psychological states.
💡 Professional Execution Tip:
Always wait for the trigger candlestick to fully close before entering a market position. Entering prematurely during an open candle frequently results in false breakouts and wick traps. In addition, avoid opening new positions during high-impact macroeconomic releases (e.g., US Non-Farm Payrolls or CPI announcements) when spread spikes and slippage can distort indicator signals.
🔗 Recommended Related Strategies & Indicator Guides
- Crypto Quad EMA (8, 13, 21, 55) Strategy: Learn how to optimize multi-moving average momentum and trend continuation on active market charts.
- Master Crypto & Forex Renko Trading Strategy: Master filtering out market noise with brick-based price charts for higher accuracy setups.
- The Bollinger Bands Breakout Trading System For MT4: Discover complementary rules and indicator setups to enhance your trading edge.
- The Boomerang Forex Trading System For MT4: Explore alternative entry triggers and exit management for MT4 traders.
⚠️ Risk Warning: Foreign exchange and CFD trading carries a high level of risk to your capital and may not be suitable for all investors. Leverage can work against you as well as for you. Before deciding to trade foreign exchange, carefully consider your investment objectives, level of experience, and risk appetite. Never risk money you cannot afford to lose, and always thoroughly backtest trading strategies on a demo account before risking live capital.