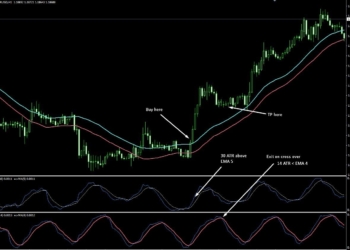
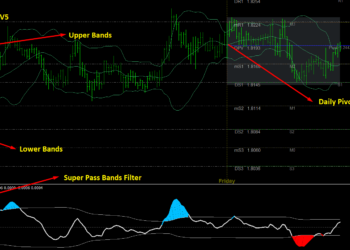
The Bouncing Ema and KG analysis Trading System For MT4 is a profitable trading strategy that is designed for 30 minutes and a 1-hour timeframe. This trading strategy's main aim is to catch the impulsive movement as soon as the news release.
📌 Strategy Summary & Key Parameters
- Strategy Name: The Bouncing Ema and KG analysis Trading System For MT4
- Platform: MetaTrader 4 (MT4)
- Trading Style: Trend Following & Momentum Breakout
- Recommended Timeframes: M15, H1, H4, Daily
- Recommended Asset Classes: Major & Cross Currency Pairs (EUR/USD, GBP/USD, USD/JPY, EUR/JPY, GBP/JPY)
- Core Technical Tools: This trading strategy aims to catch the movement after news release and ensure the accuracy using the MACD and Stochasti
- Risk Management: 1% to 2% risk per trade with 1:1.5+ Risk-Reward Ratio
The forex market is an international market where news and economic releases affect a currency pair's price. Therefore, by using the news effect, we can make a decent profit using this trading strategy.

What is Bouncing EMA?
EMA or Exponential Moving Average is a trading indicator that defines the strength of a trend.
Why is Trend Important in Forex Trading?
The forex market remains ranged in almost 70% of the time. In a ranging market, price barely makes higher highs and lower lows. Therefore, it is difficult for traders to make money in the ranging market. On the other hand, in the trending market, the price creates higher highs and lower lows, aggressively indicating an imbalance between buyers and sellers.
In forex trading, most of the trend following strategy, including the Bouncing EMA, works well when the price moves within the trend.
Based on the trader's activity in the price, there are several levels and zone from where a significant market reaction set, and Bouncing EMA is one of these.
For example, the dynamic EMA level, like the EMA 50, is a dynamic level that works as an essential support and resistance level. if the price approach to that level, following other trading conditions, will provide an excellent movement by bouncing from that level.
What is KG Analysis?
KG analysis is a process to get an overall outlook of the market using several trading indicators like ATR, Daily or weekly range, Trend analysis, etc.
The KG analysis is a trading indicator that is available free to download for the MT4 platform. If you want to get a summary of the market outlook, this indicator might help. However, in this trading strategy, we will focus on Bouncing EMA, and if you want to increase the trading accuracy, you can add the KG Analysis into it.
The Bouncing Ema and KG analysis Trading System For MT4
The reason behind the name "Bouncing EMA" is that the price is focused on the current trend, both bullish and bearish. When the price will make a decent movement and get rejected from any important Dynamic EMA, we will catch the movement to make a profit.
However, this type of movement is not happening every time, but you can find the right direction to focus on trading news.
When important news comes and the last data changes with the current data, a massive movement will happen in the price. Therefore, you should focus on this trading strategy after the news comes.
Let's have a look at trading instruments for this trading strategy:
- Exponential Moving Average (EMA)- value 100
- Exponential Moving Average (EMA)- value 200
- Moving Average Convergence and Divergence (MACD)- value (12,26,9)
- Stochastic Oscillator- value (5,3,3)
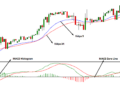
Let’s see how the chart looks like after implementing these indicators:
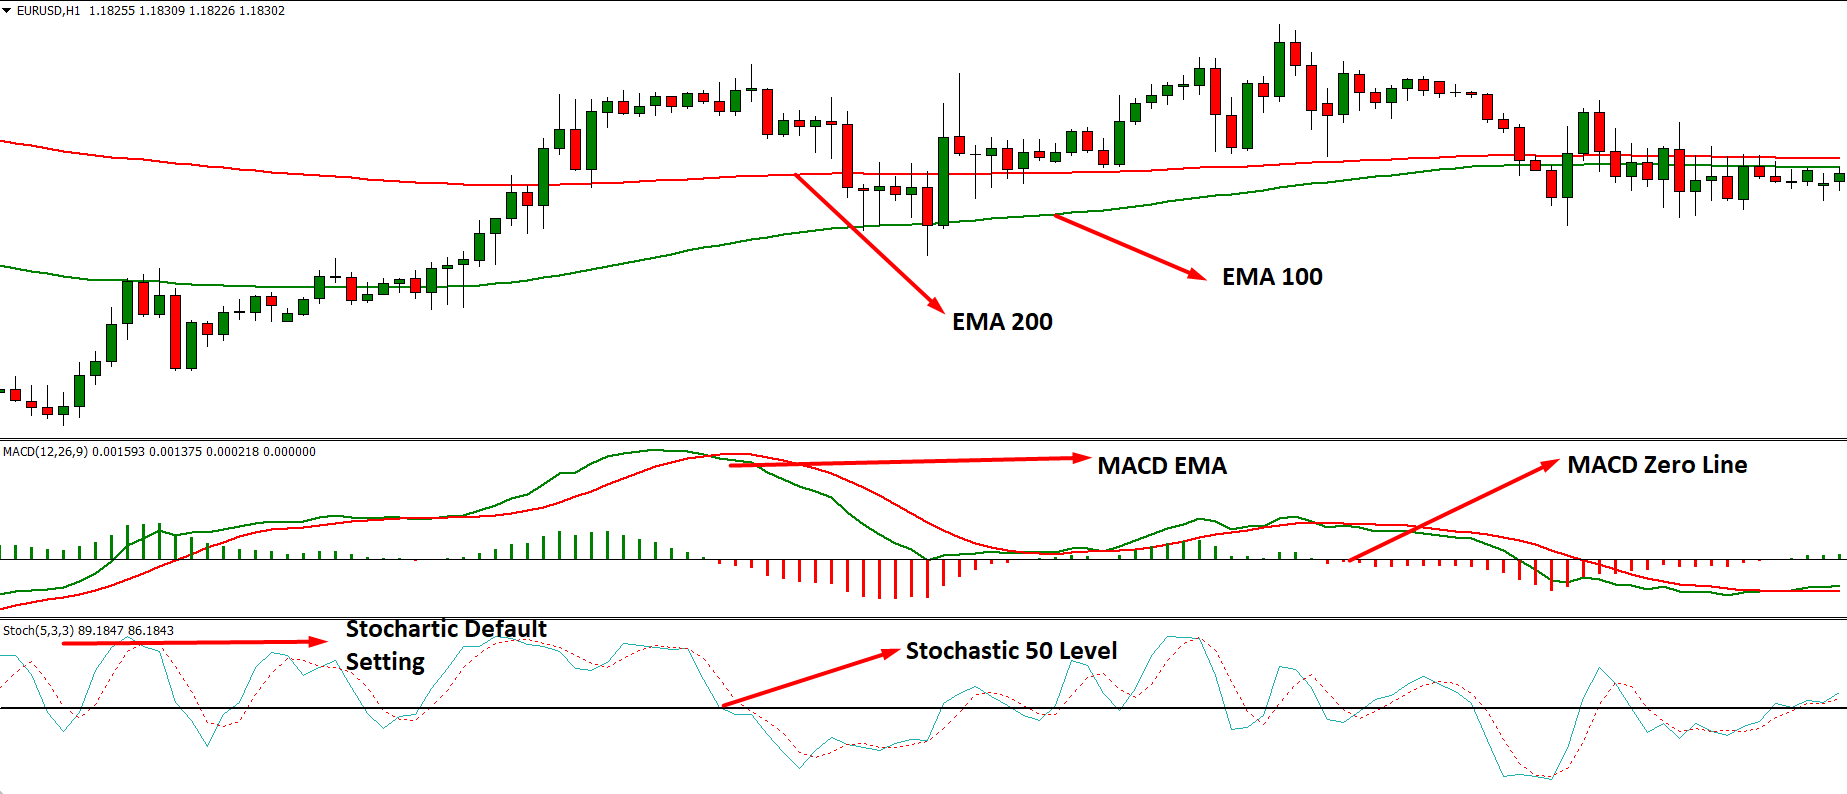
This trading strategy aims to catch the movement after news release and ensure the accuracy using the MACD and Stochastic.
Bullish Trade Setup
The Bouncing Ema and KG analysis Trading System For MT4 work well in 30 minutes and a 1-hour timeframe. As it is an intraday trade setup based on the news release, you should not apply this strategy except in H1 and M30.
Moreover, this strategy works well in every currency pairs, but you should focus on when the news will release.
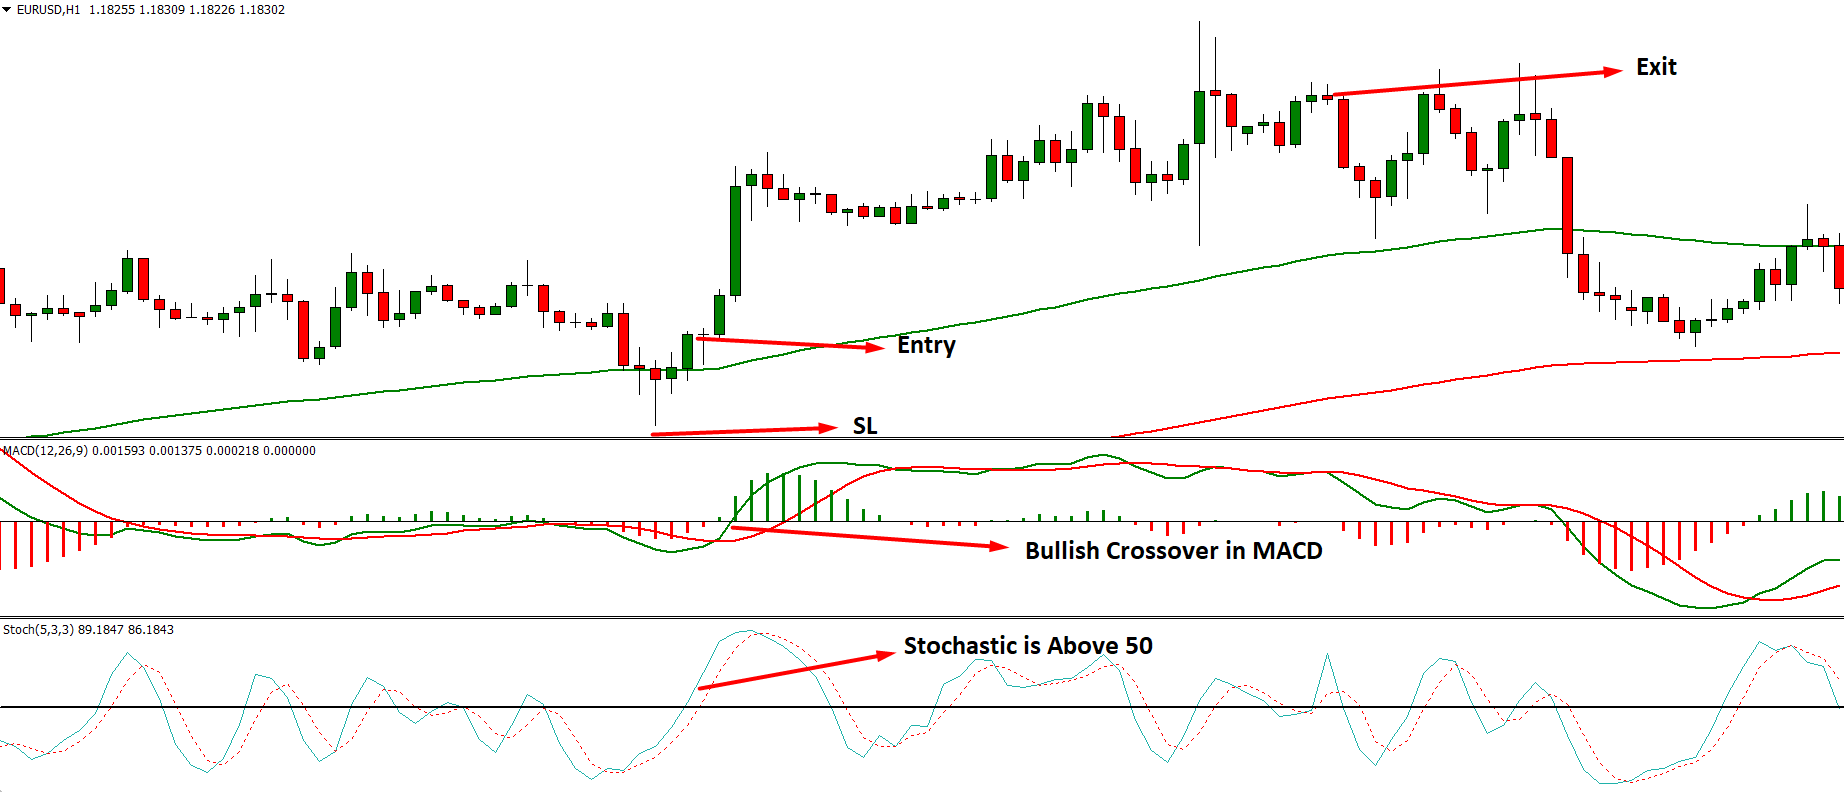
Bullish Trade Conditions
- Identify that the current market trend is bullish
- After the news, the market consolidates and test the EMA 50 (in M30) or EMA 100 (in 1-hour).
- After getting rejected from the EMA 50 or EMA 100, the price will continue the bullish trend.
- Bullish crossover in MACD happens from the negative zone.
- Stochastic moved above the 50 levels.
Entry
After confirming the above conditions, you should enter the trade as soon as bearish rejection happens in the price at EMA 50 or EMA 100 area. Make sure that you have entered the trade once the candle closes. The bearish rejection might be the bullish pinbar or the bullish two bar reversal.
Stop Loss
The stop loss for the bullish trading strategy will be below the swing low with 10 to 15 pips buffer. Moreover, if the price makes any new high, make sure to move the stop loss at breakeven to minimize the risk.
Take Profit
You should hold the trade until the opposite party comes into the market. The bearish movement's first indication is when the Stochastic will be above the 80 levels, and MACD Histogram is bearish.
Bearish Trade Setup
The bearish trade setup also works well in 30 minutes and a 1-hour timeframe as it is an intraday trade setup based on the news release.
Moreover, this strategy works well in every currency pairs, but you should focus on when the news will release.
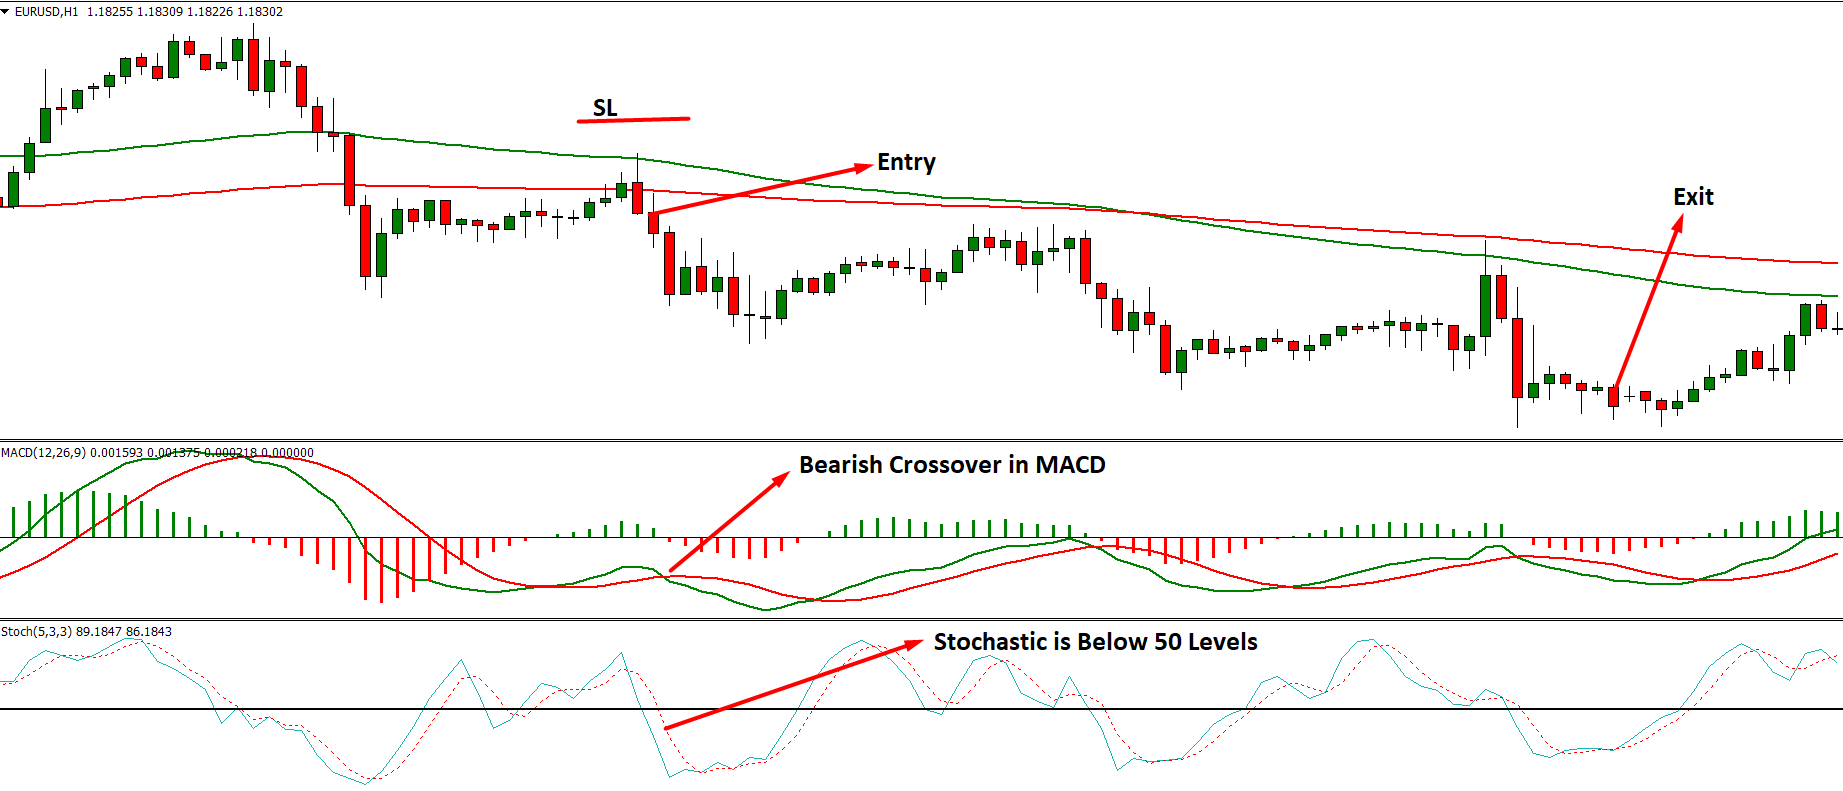
Bearish Trade Conditions
- Identify that the current market trend is bearish
- After the news, the market consolidates and test the EMA 50 (in M30) or EMA 100 (in 1-hour).
- After getting rejected from the EMA 50 or EMA 100, the price will continue the bearish trend.
- Berish EMA crossover in MACD happens from the positive zone.
- Stochastic moved below the 50 levels.
Entry
After confirming the above conditions, you should enter the trade as soon as bullish rejection happens in the price at EMA 50 or EMA 100 area. Make sure that you have entered the trade once the candle closes. The bullish rejection might be the pinbar, two bar reversal, or other candlestick patterns.
Stop Loss
The stop loss will be above the swing high with 10 to 15 pips buffer. Moreover, if the price makes any new low, make sure to move the stop loss at breakeven.
Take Profit
The bullish movement's first indication is when the Stochastic will be below the 80 levels, and MACD Histogram is bullish.
💡 Professional Execution Tip:
Always wait for the trigger candlestick to fully close before entering a market position. Entering prematurely during an open candle frequently results in false breakouts and wick traps. In addition, avoid opening new positions during high-impact macroeconomic releases (e.g., US Non-Farm Payrolls or CPI announcements) when spread spikes and slippage can distort indicator signals.
Conclusion
The Bouncing Ema and KG analysis Trading System For MT4 is a profitable trading strategy that provides fewer trade setups with higher accuracy. If you can implement this trading strategy well, you can profit with higher risk: reward every time. Overall it is a complete trading strategy that can guarantee an average profit every month.
🔗 Recommended Related Strategies & Indicator Guides
- Crypto Quad EMA (8, 13, 21, 55) Strategy: Learn how to optimize multi-moving average momentum and trend continuation on active market charts.
- Master Crypto & Forex Renko Trading Strategy: Master filtering out market noise with brick-based price charts for higher accuracy setups.
- The Braydensgrail Trading System For MT4: Discover complementary rules and indicator setups to enhance your trading edge.
- The Cowabunga Trading System For MT4: Explore alternative entry triggers and exit management for MT4 traders.
⚠️ Risk Warning: Foreign exchange and CFD trading carries a high level of risk to your capital and may not be suitable for all investors. Leverage can work against you as well as for you. Before deciding to trade foreign exchange, carefully consider your investment objectives, level of experience, and risk appetite. Never risk money you cannot afford to lose, and always thoroughly backtest trading strategies on a demo account before risking live capital.