
The Directional Key Trading System For MT4 is a simple trading method uses some trend and momentum-based technical tools to generate profitable trade ideas. Any trader who has some basic (technical, fundamental, trader sentiment, money management, etc.) knowledge about the forex market with a disciplined mind setup, can make constant profitable trading positions by using this trading system.
The Directional Key Trading System For MT4
This trading system is based on some unique calculation of market data and some well-known trend and momentum-based indicators for confirmation about the trade ideas.
List of tools/indicators
- Key Setup
- Direction
- Confirmation
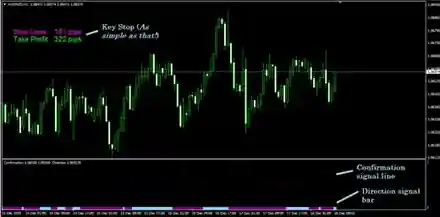
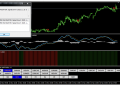
This Fig above shows a MetaTrader 4 chart after implementing all the features used in this trading method.
The key stop is showing it’s reading at the upper left corner of the main window. This indicator collects and calculates market data in such a unique way and shows a specific risk ratio point from the current price level (the reading is not the same at every time frame window).
The Confirmation (dotted) signal line becomes blue when bullish pressure creates at the asset price and becomes blue as the seller takes over the price.
The Direction signal bar changes colors at market movement/trend changes. The signal line turns blue at uptrend and becomes purple at downtrend price movement.
Explanation Of A Bullish Scenario
It is a very simple and easily applicable trading system that works fine on any (major or cross) currency pairs at any (15 min or higher) time frames. Check the conditions below before placing any buy order.
Bullish Trading Conditions
- The direction indicator signal line turns blue from purple color.
- The dotted signal line of the confirmation indicator becomes blue from red color (and heading towards upside).
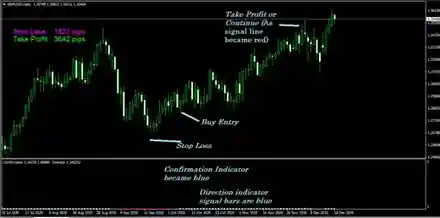
Entry
Check all the bullish conditions above are true for the target asset, then verify the order direction matches with the upper time frame window. Wait until the running candle to close and put a buy order.
Stop Loss
Stop loss for the buy entry recommend by this order would be the level as The Key Stop indicator suggests.
Note: Don’t hesitate to shift the stop position at or above the entry point as a part of risk management when the market creates the first higher high.
Take profit
Initial take profit or exit position for the buy entry would be as the level suggested by the key stop indicator at the main window.
Close the buy entry if
- The dotted line of the Confirmation indicator window gets red from blue.
- The signal bar of the direction indicator window becomes purple from blue.
Note: The buy order is safe as far as the trend remains intact, better close the position as soon as reversal happens. Cause tomorrow you may get a better chance to have more of it by placing another buy order below near new lower low with low risk and more reward ratio.
Explanation Of Bullish Scenario
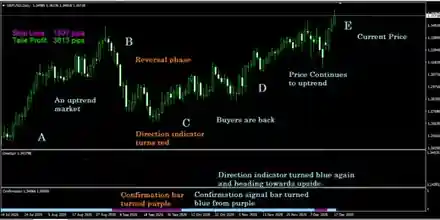
As the fig above showed when the confirmation indicator dotted signal line turns blue from red and heading towards the upside and matches the signal bar (blue) of the direction indicator. In this situation the key stop suggests trade entry of 3600+ (360X10=3600 for five digits broker) pips take profit with a stop position below 1800+ (180X10=1800 for five digits broker) pips, which means it’s likely 1:2 risk-reward entry point. That means at this level of price, this system suggests a buy order with 180 pips stop loss could worth 360 pips profit.
Explanation of a bearish scenario:
It is a very simple and easily applicable trading system that works fine on any (major or cross) currency pairs at any (15 min or higher) time frames. Check the conditions below before placing any sell order.
Bearish Trading Conditions
- The direction indicator signal line turns purple from blue color.
- The dotted signal line of the confirmation indicator becomes red from blue color (and heading towards downside).
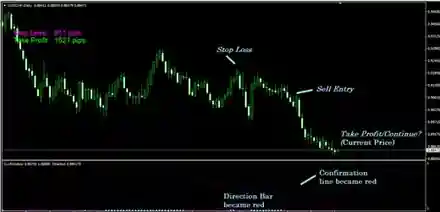
Entry
Check all the bearish conditions above are true for the target asset, then verify the order direction matches with the upper time frame window. Wait until the running candle to close and put a sell order.
Stop Loss
Stop loss for the sell entry recommend by this order would be the level as The Key Stop indicator suggests.
Note: Don’t hesitate to shift the stop position at or below the entry point as a part of risk management when the market creates the first lower low.
Take profit
Initial take profit or exit position for the sell entry would be as the level suggested by the key stop indicator at the main window.
Close the sell entry if
- The dotted line of the Confirmation indicator window gets blue from red.
- The signal bar of the direction indicator window becomes blue from purple.
Note: The sell order is safe as far as the trend remains intact, better close the position as soon as reversal happens. Cause tomorrow you may get a better chance to have more of it by placing another sell order above near new higher high with low risk and more reward ratio.
Explanation Of Bearish Scenario
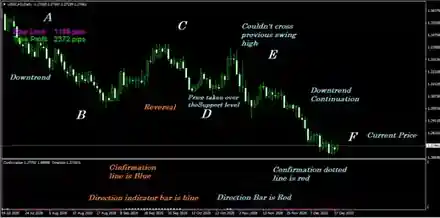
As the fig above showed when the confirmation indicator dotted signal line turns red from blue and heading towards the downside and matches the signal bar (purple) of the direction indicator. In this situation the key stop suggests trade entry of 2300+ (230X10=2300 for five digits broker) pips take profit with a stop position below 1150+ (115X10=1150 for five digits broker) pips, which means it’s likely 1:2 risk-reward entry point. That means at this level of price, this system suggests a buy order with 115 pips stop loss could worth 230 pips profit.
Conclusion
This system is mainly based on some technical tools that calculate price movement (trend, range, etc.) data and suggests trade ideas. At the same time, it ignores other fundamental reasons that cause price movement. So it’s better to avoid trade major currency pairs with this trading strategy during FOMC meeting minutes, FED interest rate decision, NFP, GDP report, etc any kind of major fundamental economic events for the sake of safe trading.