
The High Probability Trading Strategy For MT4 is based on Fibo Pivot and ZigZag indicators to determine the price’s appropriate swing level. Like other trend trading strategies, this method has a higher probability of showing a decent movement, but you have to apply the method with an appropriate system. In today’s section, we will see How the High Probability Trading Strategy works in the MT4 chart and how you can generate a profitable bullish and bearish trading strategy using this method.
The High Probability Trading Strategy For MT4
This trading strategy has a higher probability of making a profit in any major currency pairs with a systematic approach.
It is a trend trading system, and like other trend trading strategies, we will identify the major market direction and follow the trend from an appropriate location.
The forex market is unpredictable, and the only way to sustain the market is to anticipate the price direction with a profitable method.
In The High Probability Trading Strategy, we will anticipate the price by observing the swing level of price and confirmations from multiple indicators.
Before moving further, let’s see the list of indicators in this method:
- ZigZag
- Fibo Pivot
- Stochastic Oscillator
The image below shows a fresh chart of USDCAD with these indicators where the ZigZag indicator directs the swing points.
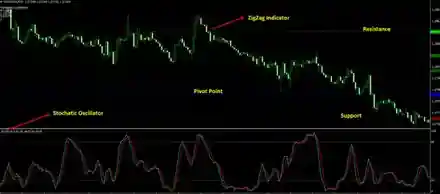
The ZigZag indicator shows the trend changing point by making a reversal from the swing level. However, the drawback of this indicator is that it is a repaint indicator. Therefore, it changes the swing level until the swing level established. As a result, it is often not wise to believe in these indicators only.
Therefore, in this method, we can eliminate the drawback by using the Stochastic. The Stochastic is an important indicator from the Oscillator class that moves from zero to 100 level.
In Stochastic, above 80 levels is considered an overbought zone, and below 20 is considered an oversold zone.
Therefore, when the price is below the 20 levels (or above the 80 levels), we can anticipate that the current trend may reverse.
However, in this system, we will use the continuous nature of Stochastic. When this indicator starts to move higher from the 20 levels, it may continue the current momentum indicating a trend continuation pattern (same as the bearish scenario).
Lastly, Pivot Point is the widely used indicator that shows the equilibrium point of a trading asset.
What is the Equilibrium Point?
The equilibrium point is a price level where supply and demand remain almost the same. Usually, the price moves higher when demand exceeds the supply and moves lower when supply exceeds demand.
Therefore, when the price moves above the equilibrium point, we can say that the demand is higher than the supply so that the price may move higher. Similarly, the price moves below the Pivot Point on the bearish scenario means it may move lower in the coming days with a higher supply.
Moreover, this indicator has Support/ Resistance levels to show the price reversal zone to consider the take profit level.
The following section will see the exact trading strategy in both bullish and bearish market conditions.
Bullish High Probability Trading Strategy
The Bullish trading system is suitable for all major pairs in 30 minutes timeframe or above. Moreover, this method uses multiple timeframes to ensure trading accuracy.
For example, if we are trading on 30 minutes timeframe, we should see what is happening in the H1, H4 and Daily timeframe. When all timeframes match, we will open the position.
Make sure to stick on major currency pairs only as minor and exotic pairs has a higher trading cost.
Conditions
- A swing low is formed, and bearish rejection candlestick appears in the h1 timeframe.
- Similarly, a bullish indication appears in the H4 and Daily timeframe.
- After identifying the price direction from the H1, H4 and D1 timeframe identify the bearish rejection from ZigZag swing low in 30 minutes timeframe.
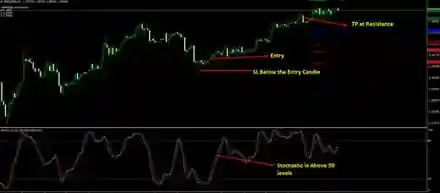
- Stochastic is above the 50 levels to indicate the continuation of the current trend in 30 minutes chart.
- Price is above the Pivot Point to confirm that the demand is higher than the supply.
Entry
The bullish position comes from the bearish rejection at ZigZag swing low. The rejection might be the bullish pin bar, engulfing bar, or two bar. Open the trade after the rejection is completed.
Stop Loss
The aggressive approach of the stop loss is below the bearish rejection candle with some buffer. As we are trading in 30 minutes timeframe, you can set the stop loss 10 pip below the reversal candlestick.
Take Profit
We will consider the take profit level using the Pivot resistance level. At first, you can close the 50% of the trade using 1:1 R: R and wait for Pivot resistance rejection. As soon as the rejection happens in the price, close the full trade.
Bearish High Probability Trading Strategy
The Bearish trading system is also suitable for all major pairs in 30 minutes timeframe or above.
Moreover, this method uses multiple timeframes to ensure trading accuracy.
For example, if we are trading on 30 minutes timeframe, we should see what is happening in the h1, H4, and Daily timeframe.
Conditions
- A swing high is formed, and bullish rejection candlestick appears in the h1 timeframe.
- Similarly, a bearish indication appears in the H4 and Daily timeframe.
- After identifying the price direction from the H1, H4 and D1 timeframe identify the bearish rejection from the ZigZag swing high in 30 minutes timeframe.
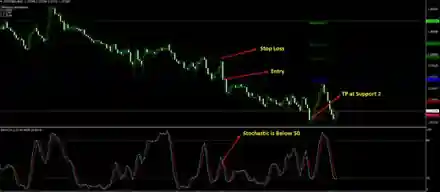
- Stochastic is below the 50 levels to indicate the continuation of the current trend in 30 minutes chart.
- Price is below the Pivot Point to confirm that the supply is higher than the demand.
Entry
The bullish position comes from the bullish rejection at the ZigZag swing high. The rejection might be the bearish pin bar, engulfing bar, or two bar. Open the trade after the rejection is completed.
Stop Loss
The aggressive approach of stop loss is above the bullish rejection candle with some buffer. As we are trading in 30 minutes timeframe, you can set the stop loss 10 pip above the reversal candlestick.
Take Profit
We will consider the take profit level using the Pivot support level. At first, you can close 50% of the trade using 1:1 R: R and wait for Pivot support rejection. As soon as the rejection happens in the price, close the full trade.
Summary
Let’s summarise The High Probability Trading Strategy For MT4:
- This trading strategy is based on Fibo Pivot and ZigZag indicators to determine the price’s appropriate swing level.
- The Bullish and bearish trading system is suitable for all major pairs in 30 minutes timeframe or above.
- The trading entry comes from the rejection at the ZigZag swing high.
- The stop loss is based on the reversal candlestick and take profit is based on the Pivot Support or resistance levels.