
The KiwiK Trading System For MT4 is an easily adaptable trading method. If you have the basic knowledge about the forex market, you can easily apply it in the financial market. It is a short term trading strategy that works fine in major forex currency pairs. If you want to build your trading career with sustainable growth in your account, consider this strategy trustworthy.
The KiwiK Trading System For MT4
This trading system uses some modified version of technical tools/ indicators to identify profitable trading positions. When all tools used in this system indicate the same direction, you should open the trade.
Before that understanding every tool in this strategy is important. Otherwise, it will be heard to take trading decisions. Here is the list of indicators used in this strategy:
- Dynamic Support/Resistance
- Fast Slow
- Power Bar
- Balance of Power
- BSP Volume
- KP Bar Color
- KPV Force
- V Ratio
- William 36
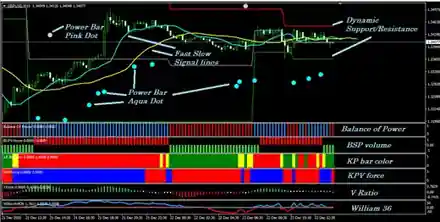
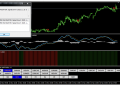
The above image is the visual presentation of these trading tools where you can see the name of indicators on this right side in a separate window. Moreover, there are some other indicators in the main chart that are marked with the name.
Tools For The KiwiK Trading System
Before proceeding to the exact trading strategy, we should understand every element and in this section, we will see the major use of custom indicators:
Dynamic Support/ Resistance
Dynamic Support/Resistance is a custom made indicator that collects and calculates the market data. Later on, it shows the dynamic price movement changes, pivot points, support, and resistance for the implemented asset. The Support line is colored green, the resistance line is red and the pivot line is colored grey.
The Fast Slow
The Fast Slow is a custom-made Moving Average indicator. You can call it a combination of two different (fast and slow) Moving Average lines, colored yellow and aqua. When the asset price gets bullish pressure, the aqua line will cross above the yellow signal line and vice versa.
Power Bar
The Power Bar is a custom made indicator that creates Aqua and Pink colored bars/dots below or above the candlestick. Aqua circles below the current market price indicate an upcoming bullish price movement in the price. On the other hand, this indicator creates Pink circles above the current candlestick for a bearish move.
Balance of power
Balance of power is also a custom made indicator with two different colored Histogram on a separate window.
The Blue Histogram represents the upcoming bullish pressure in the price while the red color represents a bearish price action. When the Histogram color changes, we will join the trade to remain at the beginning of the trend.
BSP volume
BSP volume is a custom-made indicator, shown in an independent indicator window with a middle (0.0) line. For an uptrend price movement, blue bars appear above the middle line and for a downtrend market, red bars will be below the middle line.
Kp Bar and KPV Color Indicator
KP bar color indicator window is marked with green and red bars. Red bars appear for the bullish movement and green bars appear for the bearish movement.
The KPV force also got two different (blue and red) bars. Red bars indicate bearish pressure and blue bars indicate bullish pressure in the price.
William 36
Lastly, William 36 is a trend following indicator that got a colour-changing signal line and a middle (0.0) level. For an upward price movement, the signal line becomes blue and for a downtrend the signal line becomes red.
Bullish KiwiK Trading System
This method is suitable for short-term traders and it works fine in any major currency pairs and the recommended time frames are 5 min to 15 min.
Bullish Trading Conditions
- The price is trending higher and an aqua dot appears below the price.
- The aqua signal line of the Fast Slow indicator crosses above the yellow signal line at the main window.
- The Balance of power indicator bar is blue.
- Red bars appeared above the middle line in the BSP volume indicator window.
- KP bar color indicator window got red bars.
- The KPV force indicator window got blue bars.
- V ratio green bars appear above the middle line.
- William 36 signal line is blue and above the middle line.
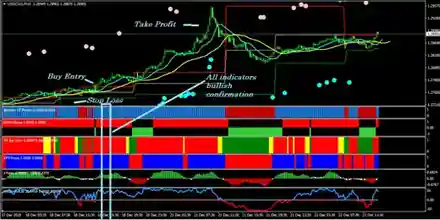
Entry
Check all the bullish conditions and wait for the current candle to close. Later on, place a buy order at a suitable price.
Stop Loss
Put the initial stop loss 10 to15 pips below the recent swing low.
Take Profit
Close the buy order based on the condition mentioned below:
- The aqua signal line of the Fast Slow indicator crosses below the yellow line.
- Red bars appear at the balance of the power indicator window.
- KP bar indicator window becomes green.
- The KPV force indicator window has red bars in it.
- Red bars appeared below the middle line of the V ratio indicator window.
- The signal line of the William 36 indicator window crosses below the middle line (becomes red).
Close the buy position as soon as the reversal occurs or when any two or more take profit conditions meet.
Bearish KiwiK Trading System
In the forex market, you can take buy as sells at a time. Therefore, this strategy works well in both bullish and bearish markets. However, the recommended time frame is 5 minutes to 15 minutes.
Bearish Trading Conditions
- A pink dot appears above the price candle.
- The aqua signal line of the Fast Slow indicator crosses below the yellow signal line at the main window.
- The Balance of power indicator bar is red.
- Green bars appeared below the middle line of the BSP volume indicator window.
- KP bar color indicator window got green bars.
- The KPV force indicator window got red bars.
- V ratio red bars appear below the middle line.
- William 36 signal line is red and below the middle line.
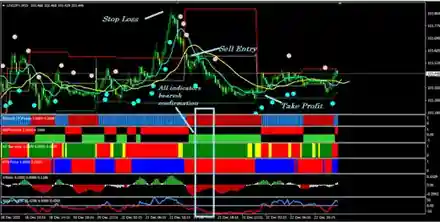
Entry
The sell trade is valid when all bearish conditions are true. Later on, wait until the current candle closes, then place a sell order at a suitable price.
Stop Loss
Put an initial stop loss above the recent swing high with a buffer of 5-10 pips.
Take Profit
Close the sell orders based on these conditions:
- The aqua signal line of the Fast Slow indicator crosses above the yellow line.
- Blue bars appear at the balance of the power indicator window.
- KP bar indicator window becomes red.
- The KPV force indicator window has blue bars in it.
- Blue bars appeared above the middle line of the V ratio indicator window.
- The signal line of the William 36 indicator window crosses above the middle line (becomes blue).
Close the sell position as soon as the reversal occurs when any two or more take profit conditions meet.
Conclusion
The KiwiK Trading System For MT4 is based on technical indicators to identify market shifting points ignoring other facts that cause change at price movement like fundamental and trader sentiment.
Therefore, it is better to avoid trade during major trend changing fundamental events, like FOMC meeting minutes, Fed funds rate, or NFP.
Overall, this method is a reliable technical analysis procedure, and it can provide an average output every month.