The MultiTimeFrame Trading System with SMA and Bollinger Bands For MT4 is a profitable intraday trading system where we need to identify the price direction from the H4 timeframe and then get the trading entry from H1 and M15. This trading strategy's uniqueness is that it is very easy to understand, and traders from every level can benefit from it.
📌 Strategy Summary & Key Parameters
- Strategy Name: The MultiTimeFrame Trading System with SMA and Bollinger Bands For MT4
- Platform: MetaTrader 4 (MT4)
- Trading Style: Trend Following & Momentum Breakout
- Recommended Timeframes: M15, H1, H4, Daily
- Recommended Asset Classes: Major & Cross Currency Pairs (EUR/USD, GBP/USD, USD/JPY, EUR/JPY, GBP/JPY)
- Core Technical Tools: In this trading strategy, if the price moves above or below all EMA, we will consider the trend as
- Risk Management: 1% to 2% risk per trade with 1:1.5+ Risk-Reward Ratio
What is Multi Timeframe Analysis?
In forex trading, the higher timeframe provides the most reliable trading result. Therefore, if we trade on H4, daily of the Weekly timeframe, we can get a better outlook of the market. On the other hand, in short term trading, we may face volatility due to news and economic activity that often make trading difficult.

Why Higher timeframe provide a reliable result?
Most of the financial institutes and professional traders use a higher timeframe to get an accurate trading idea. The main reason is that prominent institutes and people use a higher timeframe in their analysis, making the timeframe important among traders. Moreover, many investors in the forex market seek higher returns in a quarter or year, and they also use the higher timeframe in their analysis.
However, trading in a higher timeframe requires a lot of money, any effort, which is often difficult for retail traders. Therefore, if we can bridge higher and lower timeframes by determining the market direction from the higher timeframe and following the impulsive momentum in the lower timeframe, we can make a profitable trading strategy.
The MultiTimeFrame Trading System with SMA and Bollinger Bands For MT4
In this trading strategy, we will define the market trend in the H4 timeframe. If the price moves above the SMA, the trend is bullish, and if the price is trading below the SMA, the trend is bearish.
Moreover, we can increase the trading probability by using multiple-valued EMA to get a 360-degree view of the price.
Before proceeding further, let's have a look at trading tools for this trading strategy:
- Simple Moving Average (SMA)- value 34
- Simple Moving Average (SMA)- value 11
- Simple Moving Average (SMA)- value 3
- Bollinger Bands
Let's have a look at the price chart after implementing all theses trading indicators:
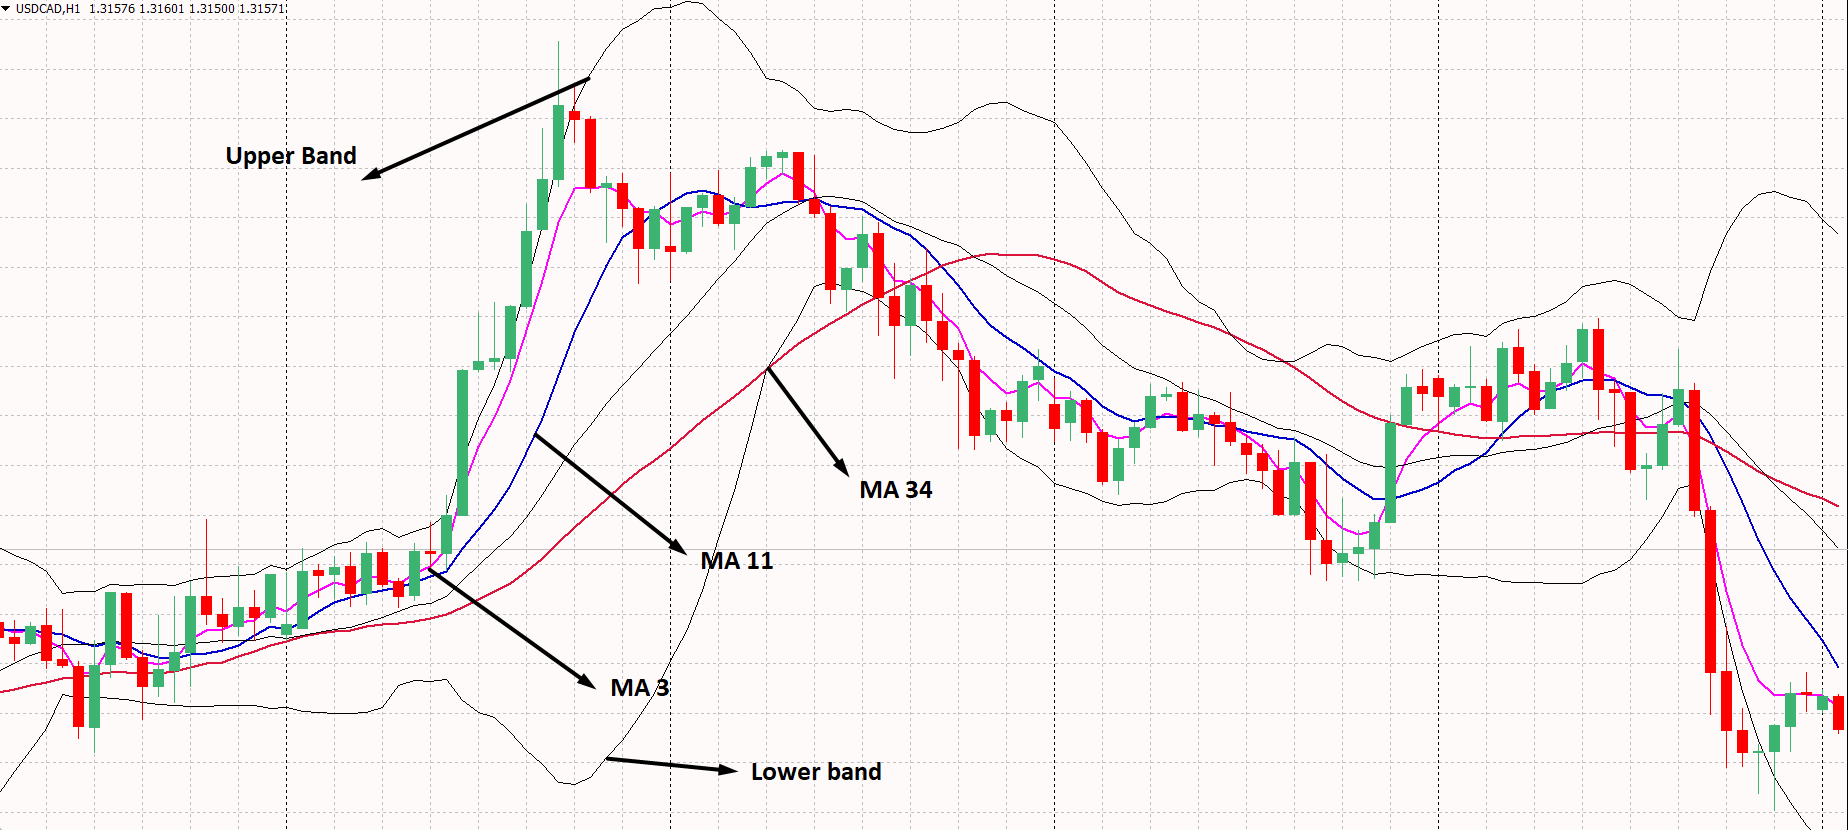
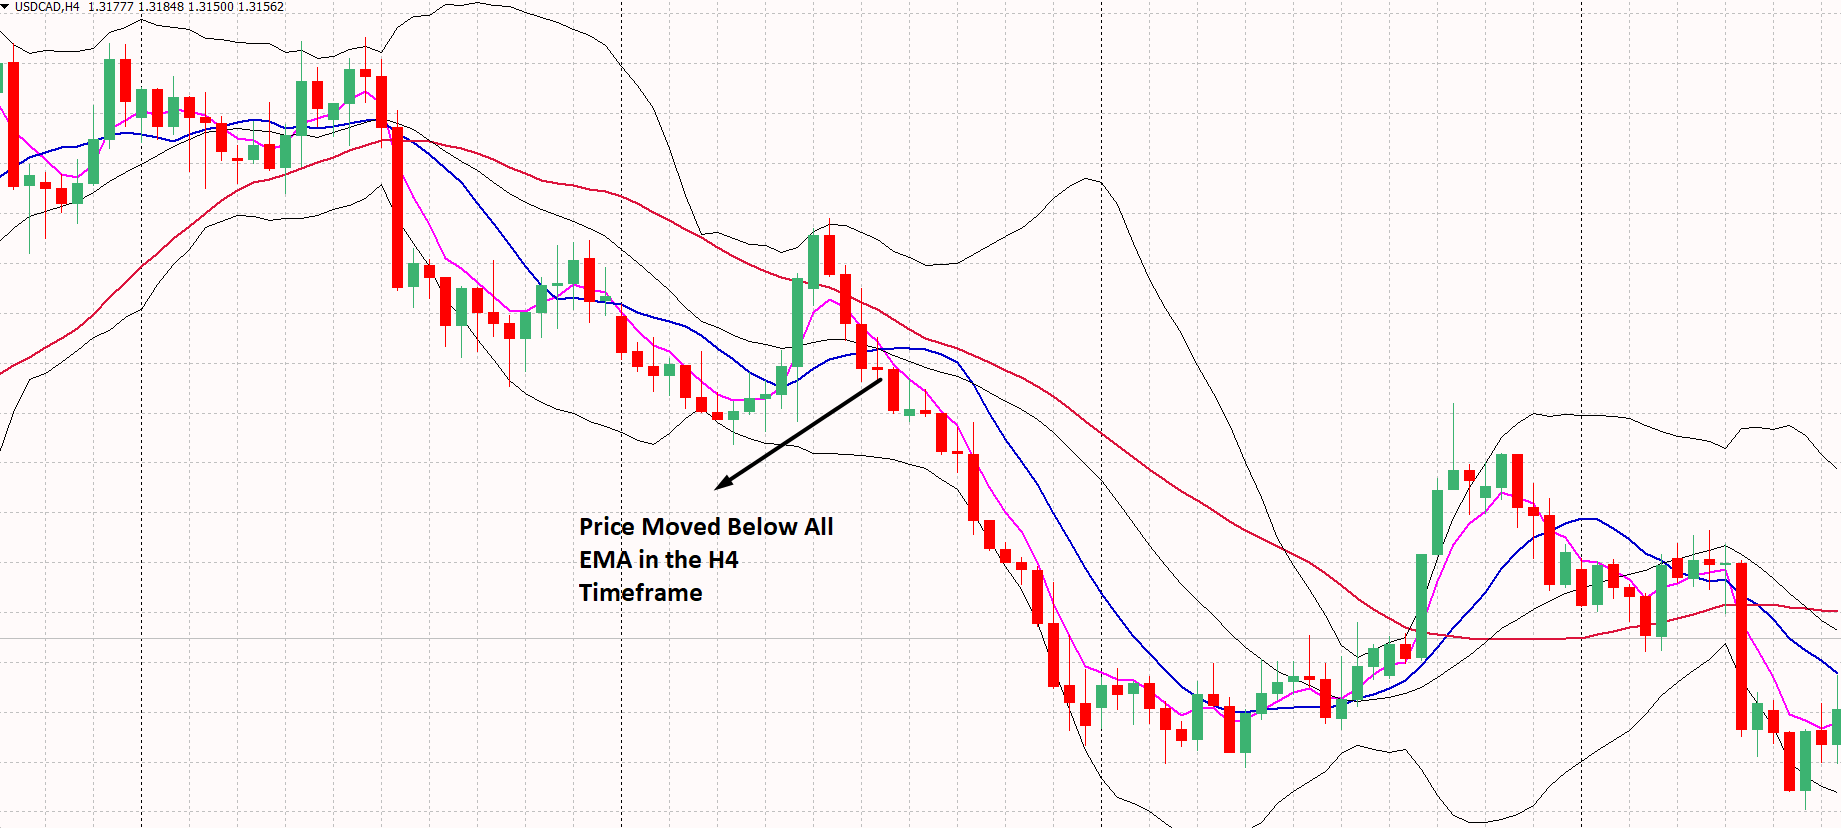
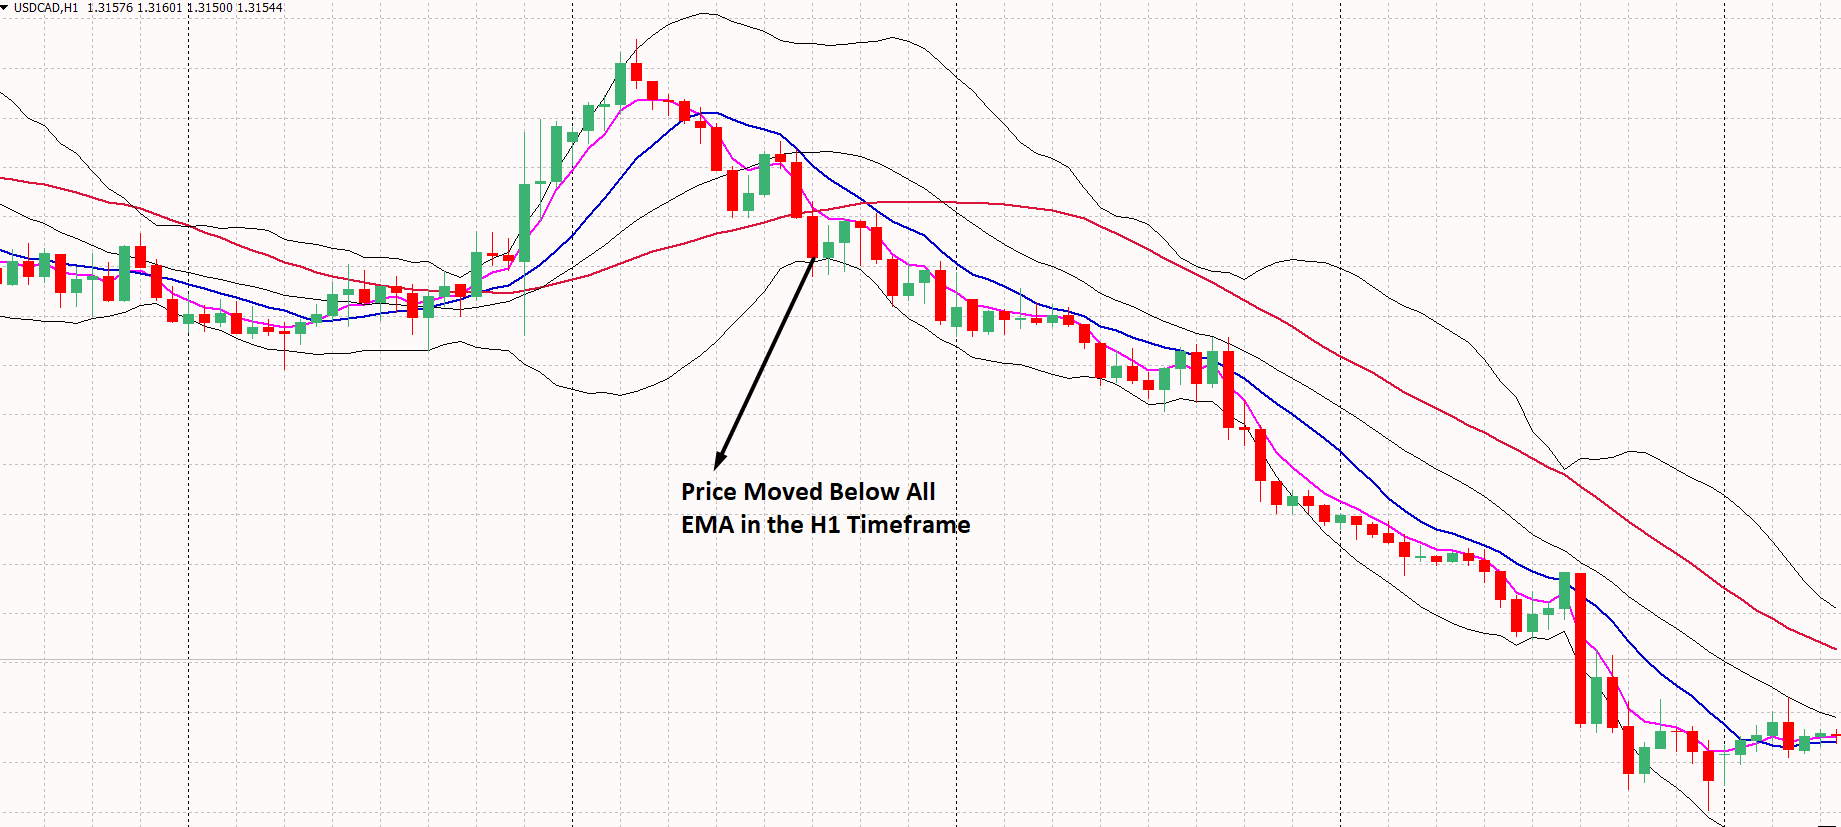
In this trading strategy, if the price moves above or below all EMA, we will consider the trend as bullish or bearish. Therefore, we will identify the same price action in H4, H1, and M15 to get the most reliable outlook. When all timeframes provide the same direction, we will enter the trade.
On the other hand, we will use the Bollinger Bands to increase the trading probability. If the price is moving up or down, the Bollinger Bands will expand. Moreover, if the Bollinger Bands squeeze towards the price, we can consider it as the end trend.
Bullish Trading Strategy
The MultiTimeFrame Trading System with SMA and Bollinger Bands For MT4 is suitable for any currency pairs, including the EURUSD, GBPUSD, USDJPY, AUDUSD, or NZDUSD. Moreover, you can apply it to any minor and cross pairs, depending on your choice. However, the trending market with low volatility is perfect for this trading strategy.
There are three different timeframes for this strategy that are from m15 to H4. Therefore, we can match the same price direction in three timeframes and get the same market momentum.
Bullish Trading Conditions
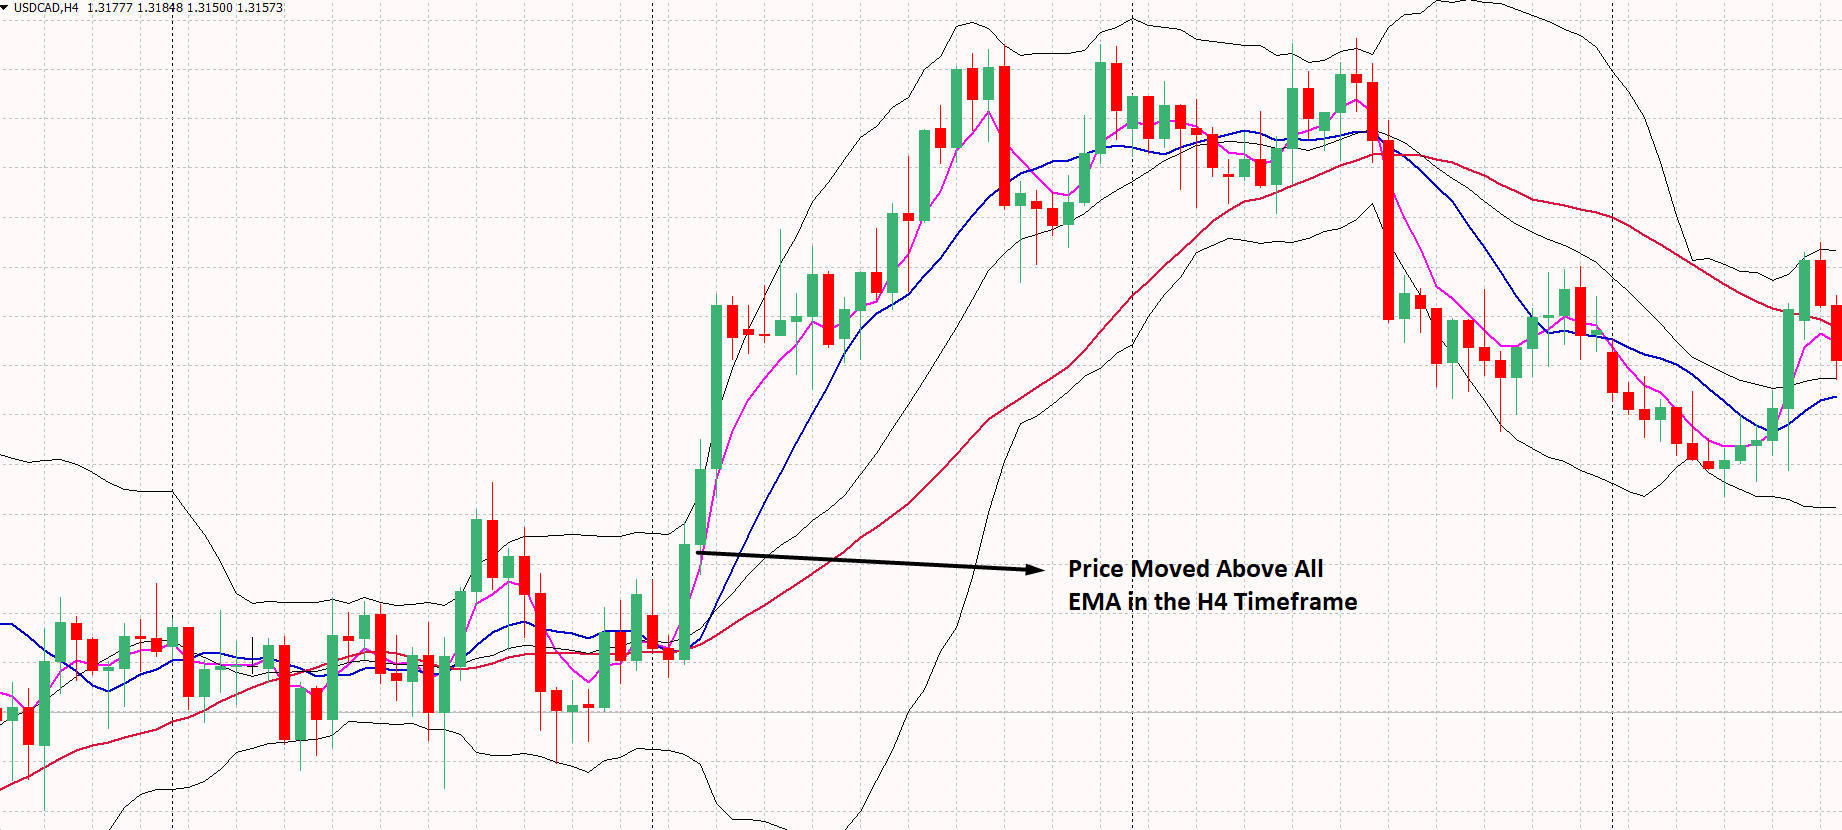
In the H4 timeframe:
- SMA 11 is above the SMA 34, pointing that the long term trend is bullish.
- SMA 3 is above the SMA 11, pointing that the short-term trend matches the long-term trend's direction.
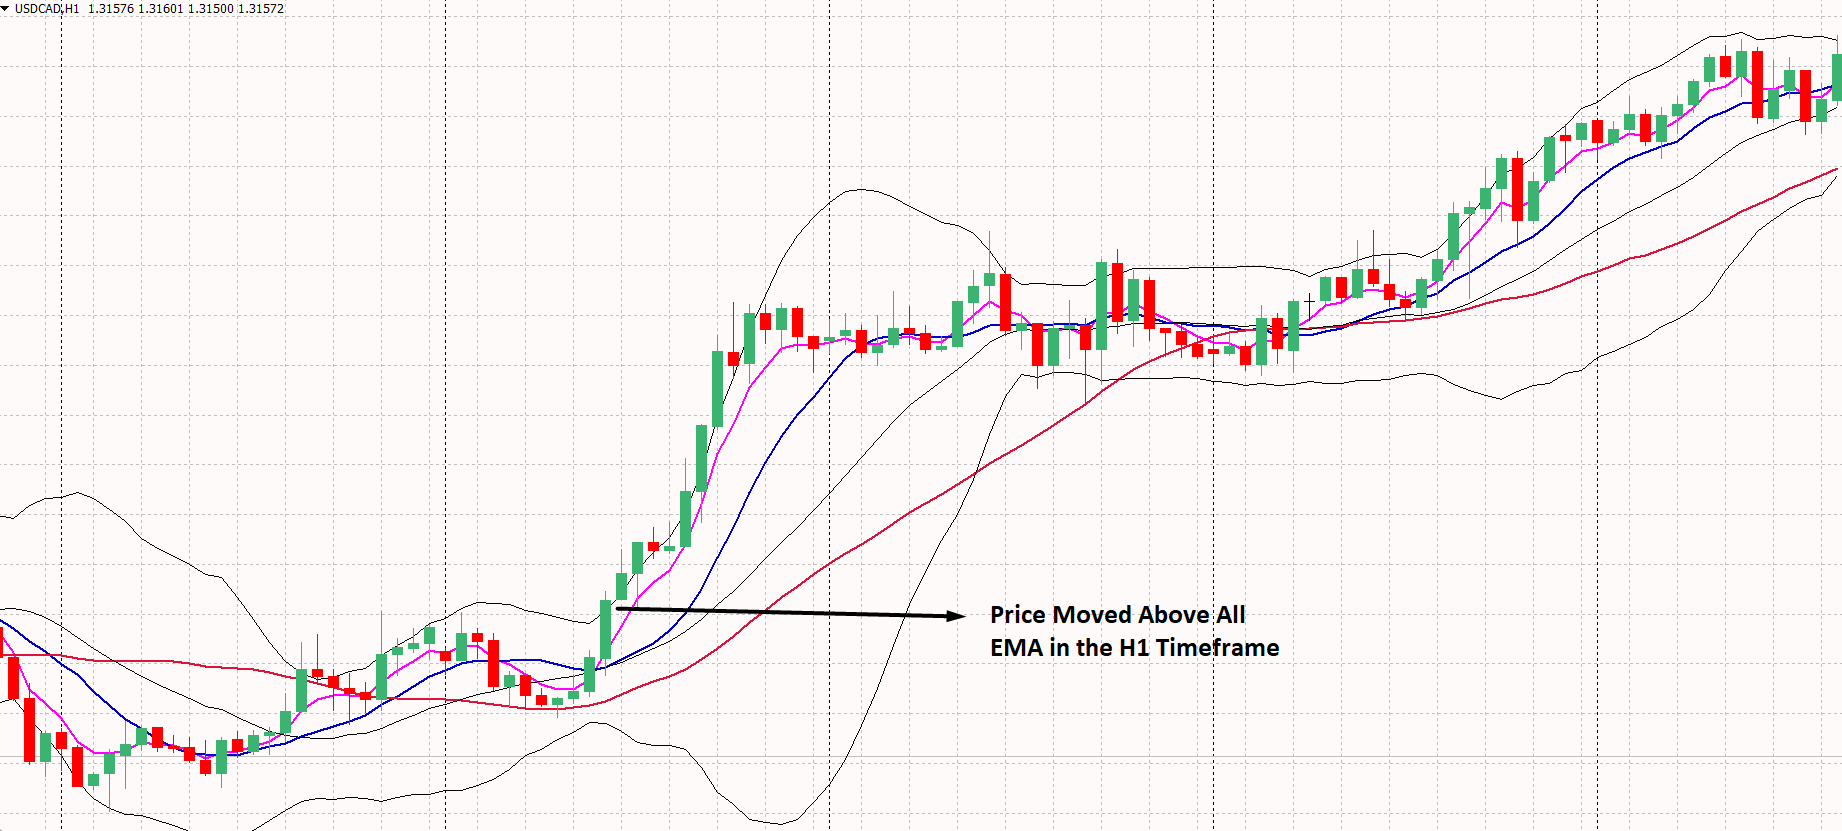
In the H1 timeframe:
- SMA 11 is above the SMA 34, pointing that the long term trend is bullish.
- SMA 3 is above the SMA 11, pointing that the short-term trend matches the long-term trend's direction.
In the m15 timeframe:
- SMA 11 is above the SMA 34, pointing that the long term trend is bullish.
- SMA 3 is above the SMA 11, pointing that the short-term trend matches the long-term trend's direction.
- Wait for a bullish candle to appear above the SMA 3 or a bearish rejection candle from the SMA 11.
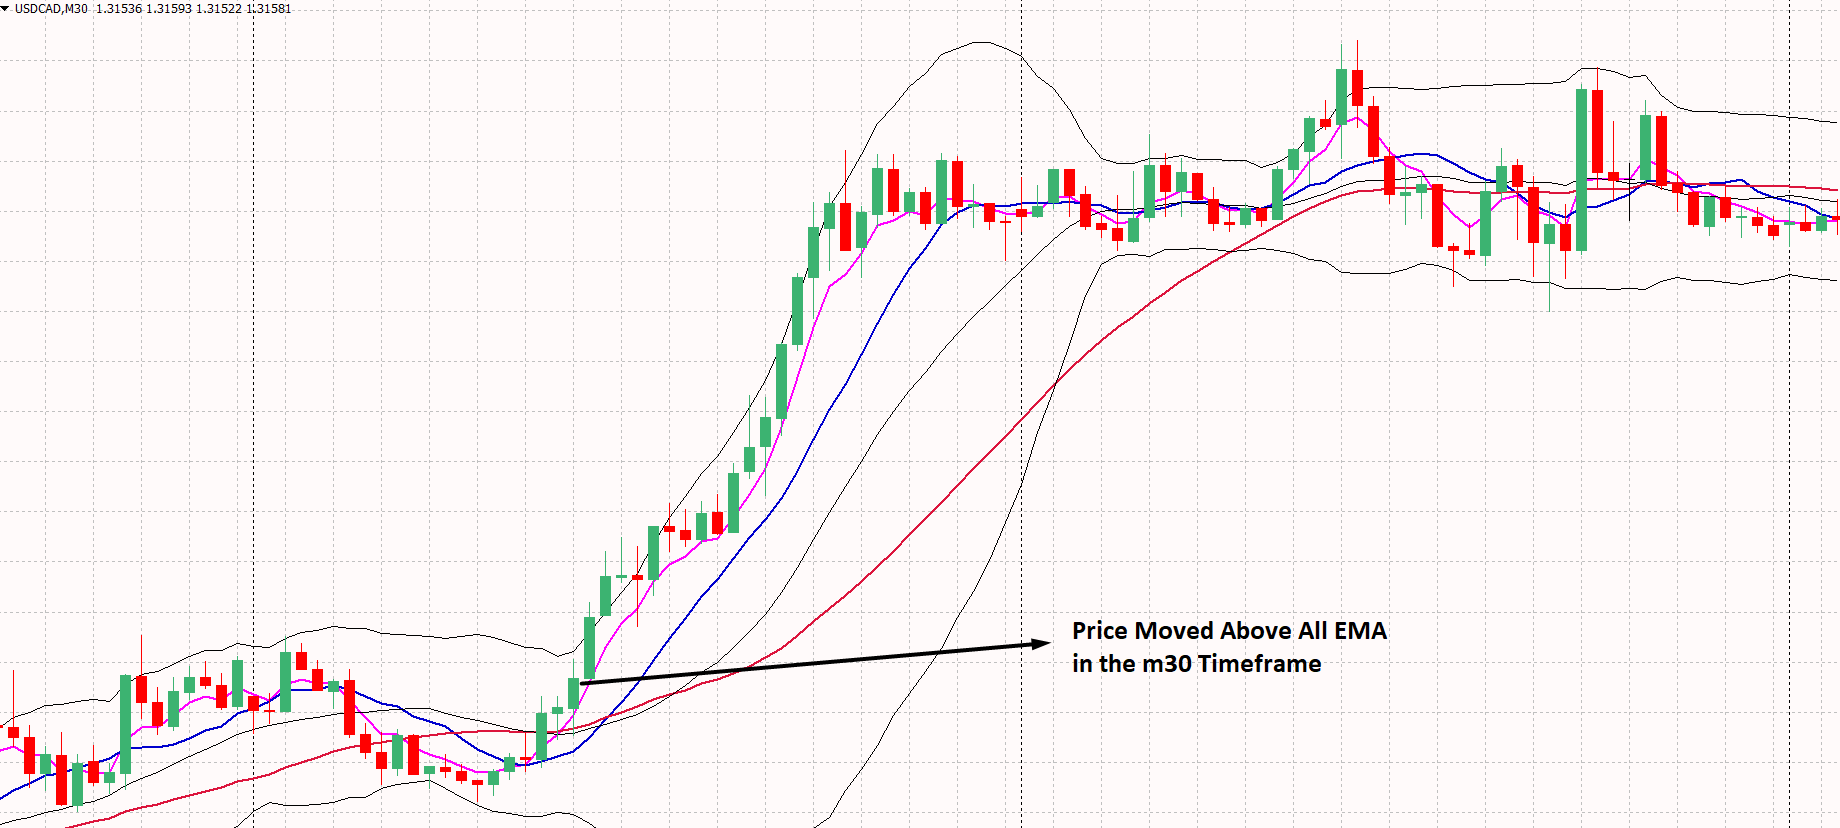
Entry
After meeting all conditions in three timeframes, you should enter the trade after candlestick formation. Make sure to enter the trade after the candle closes.
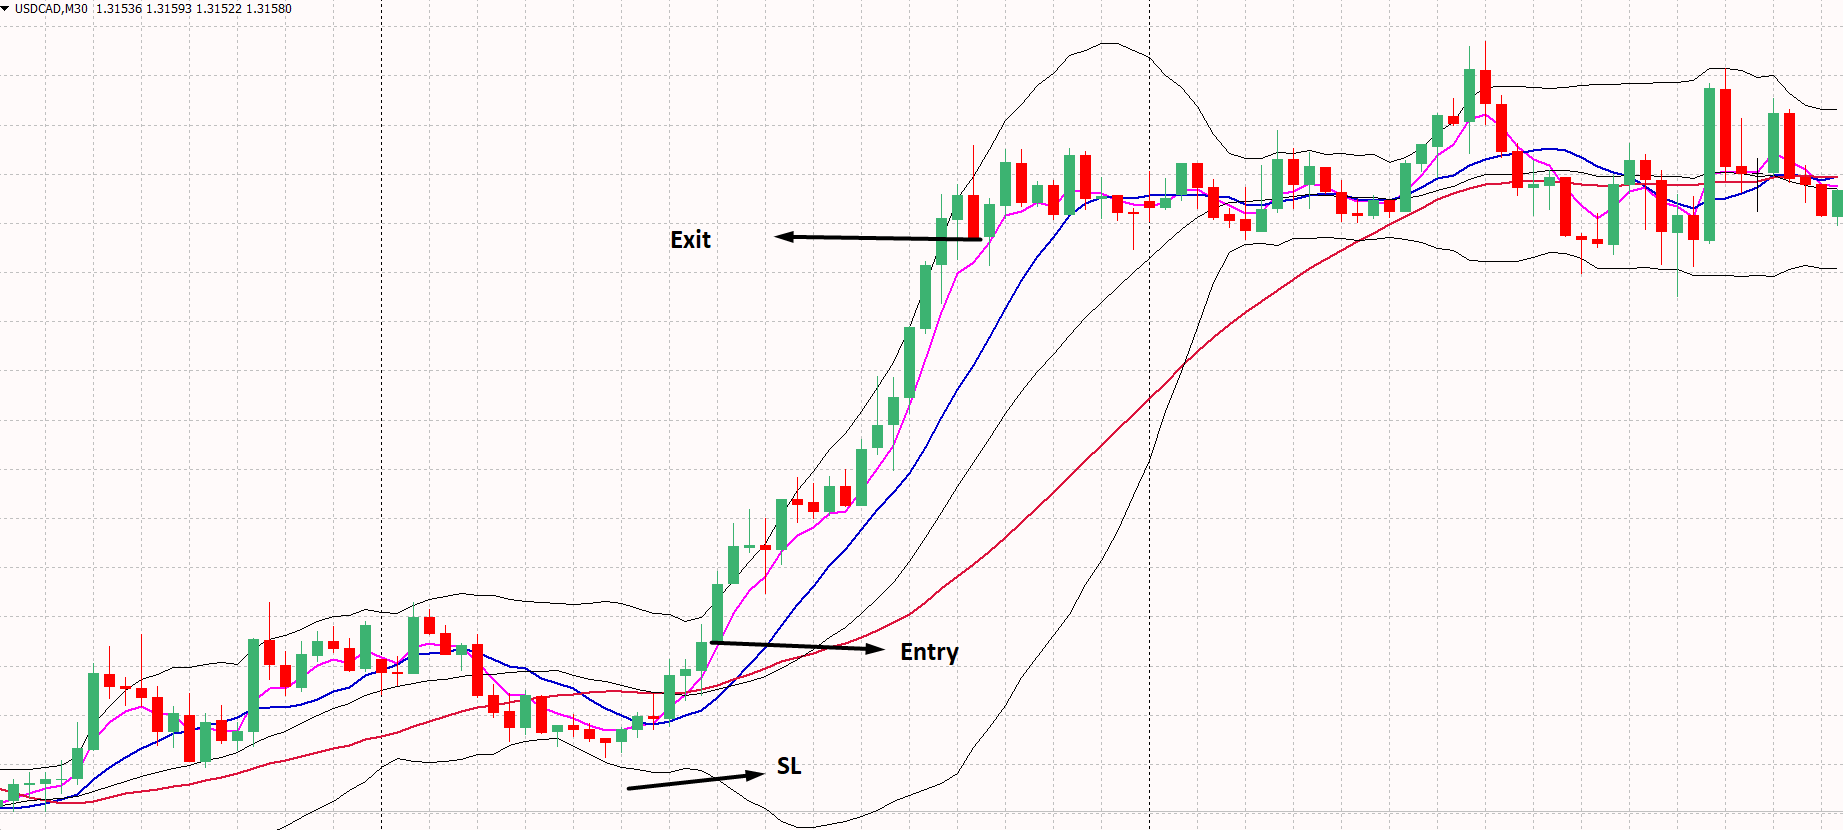
Stop Loss
The ideal stop loss is below the Bollinger Bands with five pips buffer. Moreover, you should use a trailing stop loss if the price moves higher.
Take Profit
The Take Profit will be a minimum of 2X higher than the stop loss. If the stop loss is 25 pips, the take profit will be 50 pips.
Moreover, you should move the stop loss at breakeven when the price moves 1:1 of the trade.
Bearish Trading Strategy
You can apply the bearish trading strategy in any currency pairs, including the EURUSD, GBPUSD, USDJPY, AUDUSD, or NZDUSD. Moreover, you can apply it to any minor and cross pairs, depending on your choice. However, the trending market with low volatility is perfect for this trading strategy.
There are three different timeframes for this strategy that are from m15 to H4. Therefore, we can match the same price direction in three timeframes and get the same market momentum.
Bearish Trading Conditions
In the H4 timeframe:
- SMA 11 is below the SMA 34, pointing that the long term trend is bearish.
- SMA 3 is below the SMA 11, pointing that the short-term trend matches the long-term trend's direction.
In the H1 timeframe:
- SMA 11 is below the SMA 34, pointing that the long term trend is bearish.
- SMA 3 is below the SMA 11, pointing that the short-term trend matches the long-term trend's direction.
In the m15 timeframe:
- SMA 11 is below the SMA 34, pointing that the long term trend is bearish.
- SMA 3 is below the SMA 11, pointing that the short-term trend matches the long-term trend's direction.
- Wait for a bearish candle to appear below the SMA 3 or a bullish rejection candle from the SMA 11.
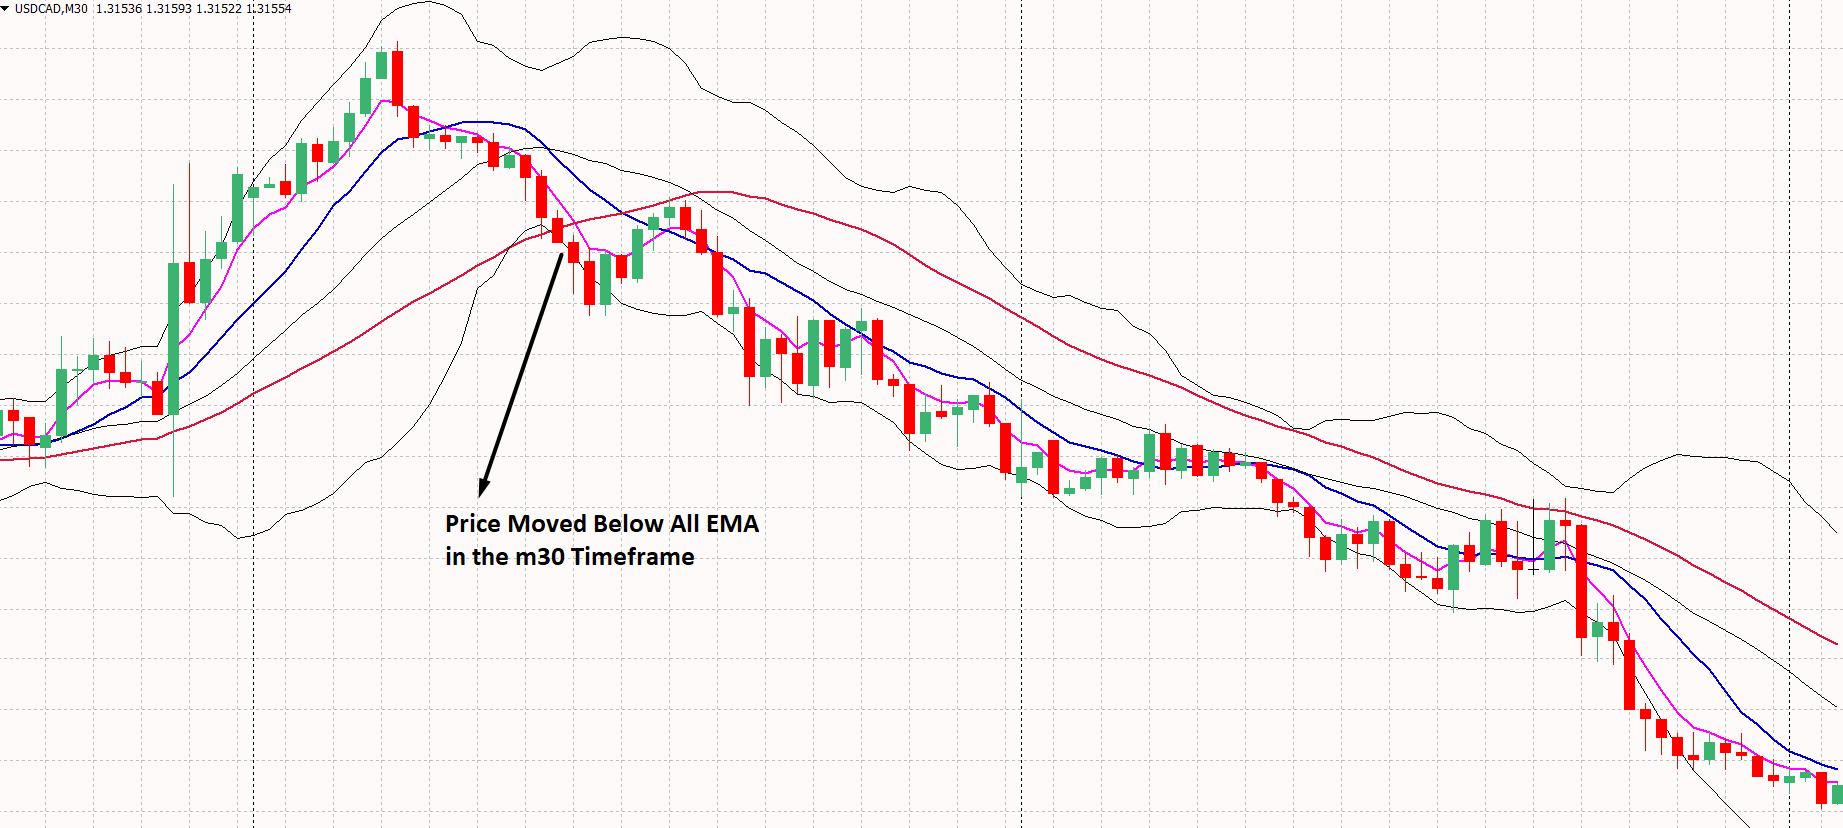
Entry
After meeting all conditions in three timeframes, you should enter the trade after candlestick formation. Make sure to enter the trade after the candle closes.
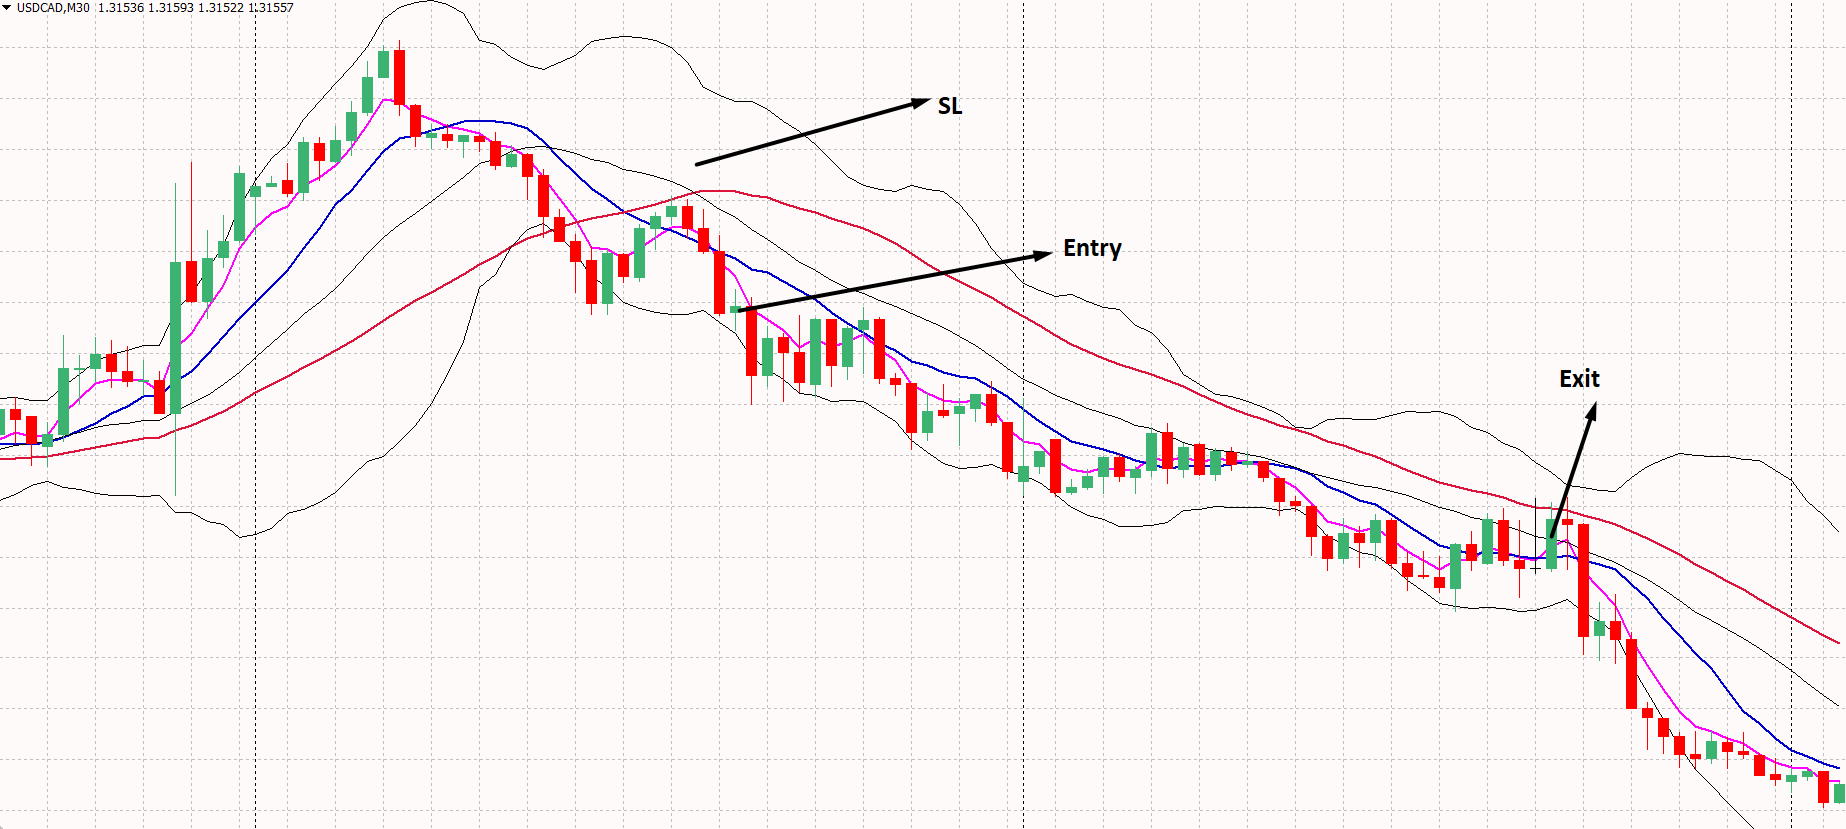
Stop Loss
The ideal stop loss is above the Bollinger Bands with five pips buffer. Moreover, you should use a trailing stop loss if the price moves higher.
Take Profit
The Take Profit will be a minimum of 2X higher than the stop loss. If the stop loss is 25 pips, the take profit will be 50 pips.
Moreover, you should move the stop loss at breakeven when the price moves 1:1 of the trade.
Conclusion- Trade Management Idea
Trade management is an important element of every trading strategy. In this trading strategy, you should follow the following trade management idea:
- Move the stop loss at breakeven after hitting the 1:1 risk: reward or create a new high or low price.
- Always take the trade that has a minimum 1:2 risk vs. reward ratio.
- Do not take more than 2% risk per trade.
Overall, this trading strategy is very profitable, and you can use it as an individual strategy without getting confirmation from other trading systems.
💡 Professional Execution Tip:
Always wait for the trigger candlestick to fully close before entering a market position. Entering prematurely during an open candle frequently results in false breakouts and wick traps. In addition, avoid opening new positions during high-impact macroeconomic releases (e.g., US Non-Farm Payrolls or CPI announcements) when spread spikes and slippage can distort indicator signals.
🔗 Recommended Related Strategies & Indicator Guides
- Directional Trend Index (DTI) Strategy: Learn how to optimize capturing early momentum shifts across volatile market conditions on active market charts.
- Best Indicators for Swing Trading Guide: Master essential technical tools for multi-day swing positions for higher accuracy setups.
- The On Trend 2 Trading System For MT4: Discover complementary rules and indicator setups to enhance your trading edge.
- The Power Bands Trading System For MT4: Explore alternative entry triggers and exit management for MT4 traders.
⚠️ Risk Warning: Foreign exchange and CFD trading carries a high level of risk to your capital and may not be suitable for all investors. Leverage can work against you as well as for you. Before deciding to trade foreign exchange, carefully consider your investment objectives, level of experience, and risk appetite. Never risk money you cannot afford to lose, and always thoroughly backtest trading strategies on a demo account before risking live capital.