
The Smart Ingsun Trading System is a unique method that uses reading from multi time frames to generate trade ideas. This is a simple trading method that any trader can easily adapt with forex trading knowledge using a multi-timeframe window.
The Smart Ingsun Trading System For MT4
This system is based on some very basic technical tools used at the MetaTrader 4 platform, but it is unique cause all features aren’t working at every time frame. Although the features used in this trading system aren’t the same at all time frames, all of the indicators reading is combined to take any order at the target asset.
List of tools/Indicators used in this system
- RDB Spread High/Low
- Bollinger Bands (5 min, 15 min)
- Moving Average (SMA 16, Low, 5 min, 15 min)
- Moving Average (SMA 16, High, 5 min, 15 min)
- Moving Average (SMA 24, Close, 1 hour)
- Moving Average (SMA 120, Close, 1 hour, 4 hours)
- Moving Average (SMA 480, Close, 1 hour)
- Moving Average (SMA 30, Close, 4 hours)
- Moving Average (SMA 96, High, 15 min)
- Moving Average (SMA 96, Low, 15 min)
- MTF MACD ( 5 min, 15 min, 30 min, 1 hour, 4 hours)
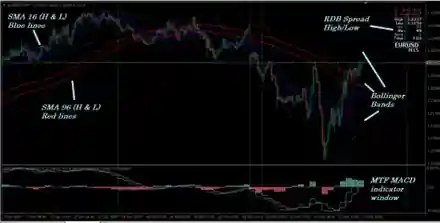
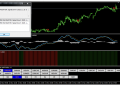
Metatrader 4 chart (15 min window) after implementing all features.
Introduction To Tools
RDB Spread High/Low is a custom made indicator that collects assets daily range (High/Low), Daily average, Current window time frame, Spreads, and so on market information and shows it at the upper right corner of the implemented asset window (all time frames).
Bollinger Bands is a popular volatility indicator that contains three signal lines (bands) that are moved with the price. When price touches the upper band, it’s an overbought price condition for the asset, and the price at the lower band indicates an oversold condition for the asset price. When the volatility reduces for the asset (or in a quiet market), the bands get closer, and the breakout happens the bands get wider. This system used Bollinger Bands at 5min and 15 min charts.
Moving Average is a commonly used technical tool for any asset (currency pairs, commodities, stocks, etc.). This trading method uses the Simple Moving Average (SMA) of different values, and not all of them appear at every time frame.
| SMA value | Color | 5 min | 15 min | 1 Hour | 4 Hour |
|---|---|---|---|---|---|
| SMA 16 (High) | Blue | Yes | Yes | No | No |
| SMA 16 (Low) | Blue | Yes | Yes | No | No |
| SMA 24 (Close) | Blue | No | No | Yes | No |
| SMA 120 (Close) | Red | No | No | Yes | Yes |
| SMA 480 (Close) | Yellow | No | No | Yes | No |
| SMA 30 (Close) | Blue | No | No | No | Yes |
| SMA 96 (High) | Red | No | Yes | No | No |
| SMA 96 (Low) | Red | No | Yes | No | No |
This table above shows the different Simple Moving Average (SMA) indicators used at different time frames.
MTF MACD is a modified MACD indicator at an independent window with two moving signal lines, a middle (0.0) level, and different (Blue/Red) colored bars above and below the middle line. Above the middle line, signal lines and blue bars indicate a bullish price movement for the asset and vice versa.
Bullish Trading Strategy
When all the above features are set at MetaTrader 4, this trading methodology suggests the finest buy entry positions. This is an intraday trading method that works fine at any currency pairs, and the perfect time frame is 15 min to place a buy order.
Bullish Conditions
- SMA 16 (high and low) blue lines cross above the SMA 96 (High and Low) red lines at 15 min.
- Price candles are at the upper channel (between the middle and upper band) of the Bollinger Bands (optional).
- SMA 24 (Blue) line crosses the SMA 120 (Red) line, and both (SMA 24, SMA 120) lines are above the SMA 480 (Yellow) line at the 1-hour window.
- SMA 30 (Blue) line crossed above the SMA 120 (Red) line at the 4-hour window.
- Signal lines are above the middle (0.0) line, and the blue bars appear above the middle line for both 15 min and 4-hour charts at the MTF MACD window.
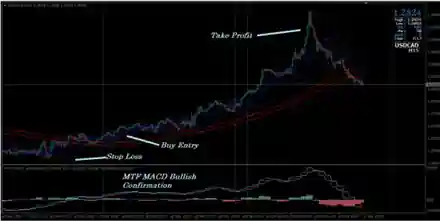
Entry
Check all the bullish conditions and wait until the running candle closes, then place a buy order.
Stop Loss
Put a stop loss below the recent swing level with a buffer of 10 pips.
Take Profit
This system suggests an initial take profit of 50-70 pips (depends on pairs sometimes) for every trade taken at the 15 min time frame for the swing intraday positions.
Bearish Trading Strategy
When all the above features are set at MetaTrader 4, this trading methodology suggests the finest sell entry positions. This is an intraday trading method that works fine at any currency pair, and the time frame is 15 min to place a sell order.
Bearish Conditions
- SMA 16 (high and low) blue lines cross below the SMA 96 (High and Low) red Lines at 15 min.
- Price candles are at the lower channel (between middle and lower band) of the Bollinger Bands (optional).
- SMA 24 (Blue) line crosses the SMA 120 (Red) line, and both (SMA 24, SMA 120) lines are below the SMA 480 (Yellow) line at the 1-hour window.
- SMA 30 (Blue) line crossed below the SMA 120 (Red) line at the 4-hour window.
- Signal lines are below the middle (0.0) line, and the red bars appear below the middle line for both 15 min and 4-hour charts at the MTF MACD window.
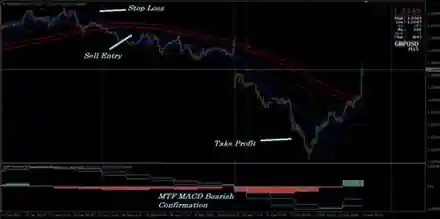
Entry
Check all the bearish conditions and wait until the running candle closes, then place a sell order.
Stop Loss
Put a stop loss above the recent swing level with a buffer of 10 pips.
Take Profit
This system suggests an initial take profit of 50-70 pips (depends on pairs sometimes) for every trade taken at the 15 min time frame for the swing intraday positions.
Conclusion
This method suggests the most accurate/probable intraday trading positions by using technical tools at several time frames but better avoid trade major pairs during FOMC meeting minutes, FED funds rate, or any other major fundamental economic events as a part of risk management.