

Weekly Forex Outlook 10 August 2026 to 14 August 2026
The upcoming trading days are going to be eventful, with several key factors to watch. One of the most important events will be the Australian monetary policy statement, which could have an immediate impact on the Australian dollar. The primary expectation is for the cash rate to remain unchanged at 4.35%. Any upbeat outcome or hawkish commentary could affect the Australian dollar positively against a basket of currencies.
On Wednesday, investors will focus on the US Consumer Price Index (CPI), which is currently expected to come in at 0.1%, compared with -0.4% in the previous reading. The financial market is currently volatile due to prevailing market sentiment, making the CPI release one of the crucial events of the week. The data could significantly affect major currency pairs, the US dollar, crude oil, and other commodities.
Among other important economic releases, the UK’s Gross Domestic Product (GDP) will also be crucial to watch. The current expectation is for a -0.1% reading, compared with the positive previous result.
The week will also feature the Core Producer Price Index (PPI), which is expected to show a 0.1% increase, compared with 0.2% in the previous report.
Other important releases include Core Retail Sales, which are expected on Friday, along with Retail Sales and the University of Michigan (UOM) Inflation Expectations.
Let’s now look at the further outlook from a technical analysis perspective from Forexpipsclub.
EUURUSD Outlook 10 August 2026 to 14 August 2026
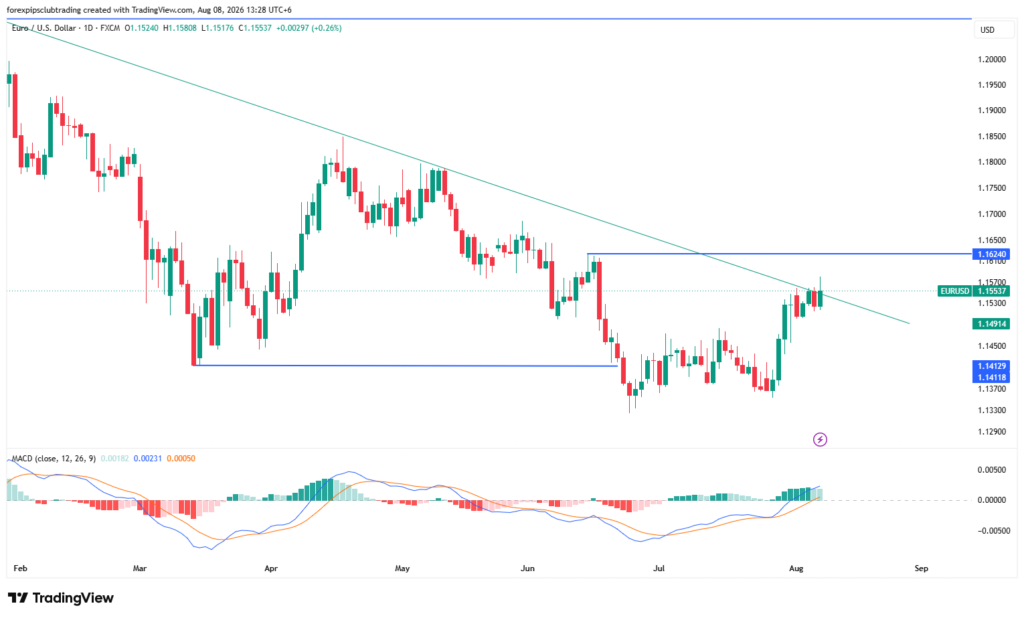
EURUSD is facing trendline liquidity, with the current price hovering around a major trendline resistance that originated in February 2026. The price is consolidating at the resistance area and has created a minor breakout. However, the strength of the breakout is not yet solid enough to consider it a confirmed trend change.
On the other hand, the overall structure remains bullish. There has been no failure to create a new low below the 1.1325 level, while the recent bullish recovery occurred without any divergence formation.
Based on this outlook, we anticipate bearish continuation, but liquidity remains pending. Traders should closely monitor how the price reacts between the 1.1530 and 1.1624 areas. A bullish continuation and recovery from this zone could resume the existing bullish trend.
The alternative approach would be a strong bullish breakout and recovery above the 1.1624 level. Such a move could open the way toward a test of the 1.2000 psychological level.
GBPUSD Outlook 10 August 2026 to 14 August 2026
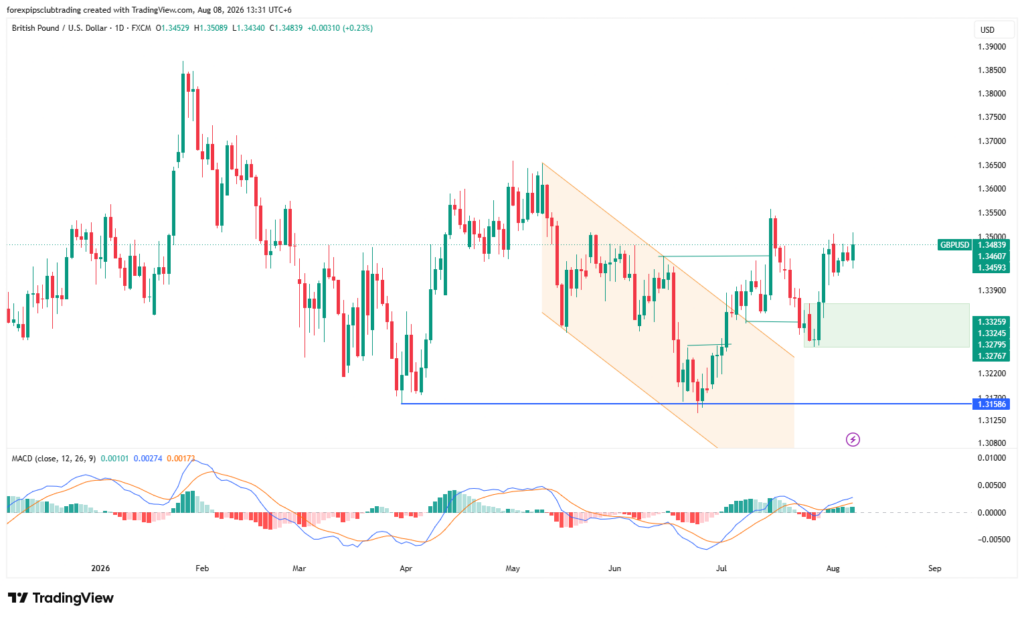
Unlike EURUSD, GBPUSD is trading with a valid bullish structure. Two bullish breaks of structure are visible. The price created a new swing low at the 1.3158 level, grabbed liquidity, and formed an immediate bullish internal break of structure.
Later, the buy-side continuation became clear as a new swing high was formed above the 1.3460 level, validating a potential trend change from bearish to bullish.
More liquidity to grab is visible around the 15–24 July area, where the price created a new swing low below the minor swing high, followed by an immediate bullish move that created an order block in the marked area.
As long as the price remains above this order block area, we anticipate bullish continuation, with the possibility of creating a new swing high and testing the 1.3651 level.
The alternative approach is to observe the price action around the 1.3557 swing-high area. A recovery from this level, followed by an immediate bearish break, could increase the possibility of the price retesting the order block.
BTCUSDT
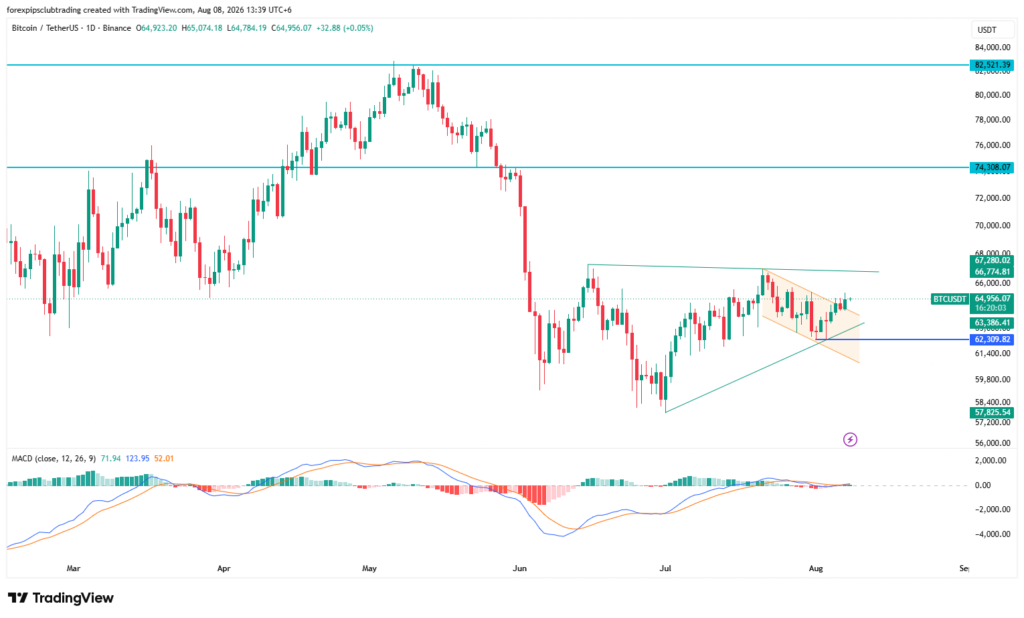
BTCUSDT has been trading bearishly for a considerable period. However, the recent swing-low formation on 25 June 2026 came with a valid liquidity grab. After that, the price rebounded higher but failed to create a new swing high above the 67,280.02 level, keeping the bullish structural shift questionable.
The price is currently squeezing within a range, where a symmetrical triangle formation is clearly visible, along with a valid descending-channel breakout on the most recent chart.
According to the primary structure, a bullish shift is possible. However, a recovery above the 67,280.02 level is mandatory before anticipating a move toward the 74,308.07 level.
XAUUSD
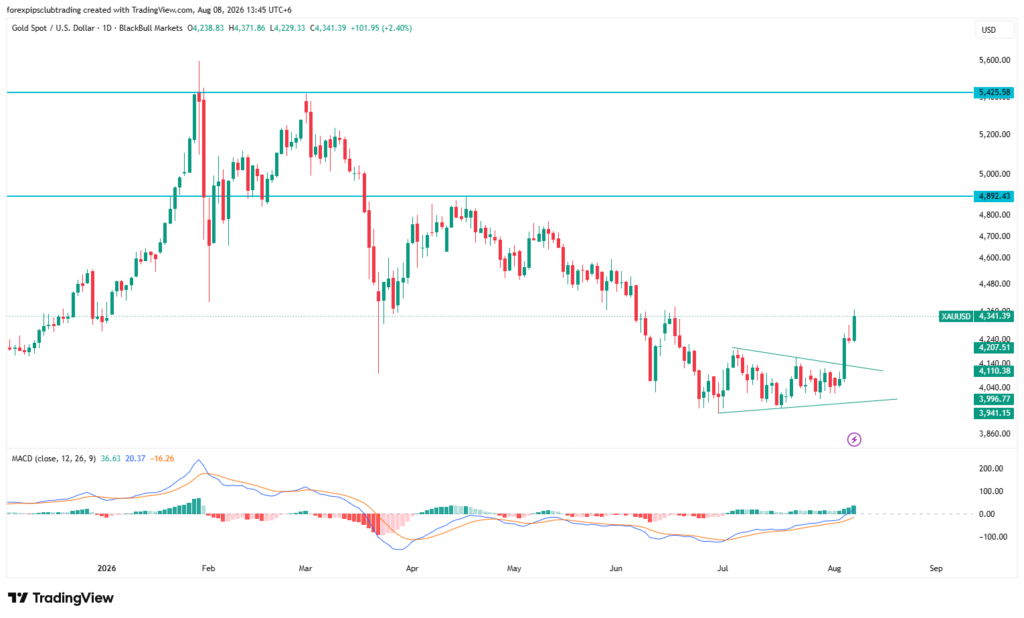
On the XAUUSD daily chart, a valid bullish range breakout is visible, and the current price is trading higher with strong bullish momentum.
Although the overall structure remains bullish, the current bullish momentum, supported by impulsive pressure, creates an opportunity for the price to move higher and test the 4,892.43 key resistance level.
The most recent candle shows a valid inside-bar breakout. A minor correction in the interim could increase the possibility of testing the 4,892.10 area.
The alternative trading approach would be to look for an immediate bearish break below the 4,200.00 psychological level. A recovery above this level could potentially resume the existing bullish trend.