• About Us
  • Broker Review
  • Contact Us
  • Crypto Review
  • Economic Calendar
  • FAQ
  • Forex News
  • Home
  • Privacy Policy
  • Prop Review
  • Terms and Conditions
Monday, November 16, 2026
  • Login
Forex Pips Club
  • Home
  • Strategy
  • Analysis
  • blog
  • Broker Review
  • Crypto Review
  • Prop Review
  • Economic Calendar
  • Contact Us
No Result
View All Result
  • Home
  • Strategy
  • Analysis
  • blog
  • Broker Review
  • Crypto Review
  • Prop Review
  • Economic Calendar
  • Contact Us
No Result
View All Result
Forex Pips Club
No Result
View All Result
Home blog

Crypto Price Channel Strategy: Top 5 Tips to Master Dynamic Ranges

Mir Kamrul Parvez Biru by Mir Kamrul Parvez Biru
November 15, 2026
in blog, Latest News, Strategy
57 1
0
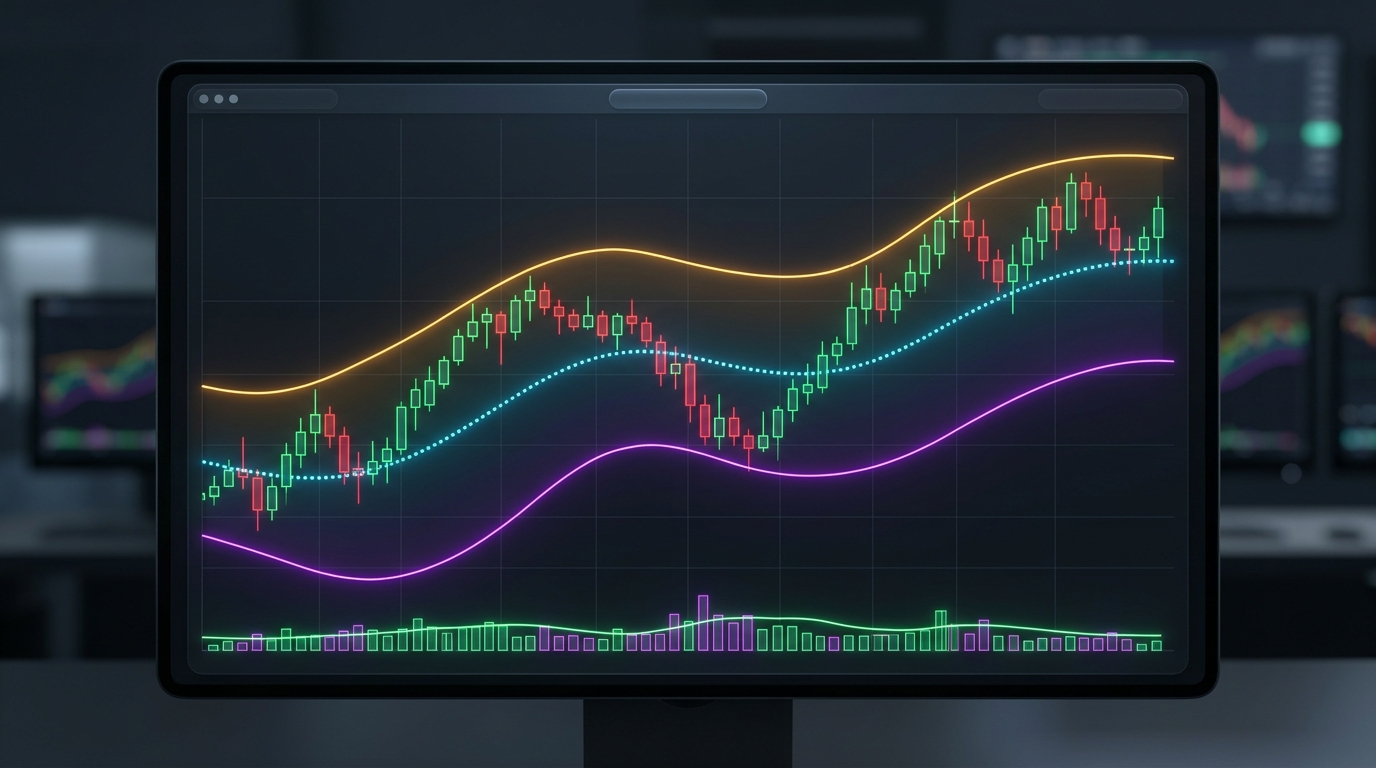
Crypto Price Channel Strategy chart illustrating dynamic channel bands with upper resistance, mid-band, and lower support

Crypto Price Channel Strategy: Dynamic Volatility Envelopes

189
SHARES
1.5k
VIEWS
Share on FacebookShare on TwitterShare on PinterestShare on Linkedin

What is the most effective price channel trading approach in volatile cryptocurrency markets? Dynamic price channels offer traders an objective map of support, resistance, and momentum transitions. Discover the top 5 professional tips to master the crypto price channel strategy and capitalize on high-probability swing setups.

i Key Trading Takeaways

  • Channel Anatomy: The Price Channel indicator calculates highest highs and lowest lows across a rolling candle lookback, creating dynamic upper, middle, and lower bands.
  • Mid-Band Pivots: Crossing above the central band signals an entry into the upper bullish channel; dropping below the mid-band confirms a transition into the lower bearish channel.
  • Band Squeeze Warning: When the outer bands converge tightly, volatility has collapsed—prepare for an impending breakout expansion.
  • Double Confluence: Confirm channel breaks with expanding trading volume and RSI crossings (>50 for longs, <50 for shorts).

What is the Crypto Price Channel Strategy?

The Price Channel indicator is a technical volatility envelope that identifies dynamic breakout, breakdown, and swing-reversal zones. By computing the highest high and lowest low over a predefined period (commonly 20 periods), the indicator constructs three boundary lines that divide price action into two distinct operational zones: the Upper Bullish Channel and the Lower Bearish Channel.


Related Articles

Crypto correlation trading strategy featuring cross-asset price trajectories between Bitcoin and S&P 500 with matrix heatmap

Crypto Correlation Strategy: Top 5 Tips to Maximize Portfolio Profits

November 15, 2026
1.5k
Greedy Crypto Trading Strategy showing high-tech cryptocurrency chart with candlestick gaps and Hull Moving Average

Greedy Crypto Strategy: Top 5 Tips to Trade Candlestick Gaps

November 15, 2026
1.5k

When adapted to crypto assets, this indicator allows traders to bypass subjective trendline drawing and rely on objective, rolling algorithmic thresholds.


Top 5 Tips for Mastering the Crypto Price Channel Strategy

Tip 1: Opening High-Probability Buy Positions

To capture early swing expansions, look for price action testing a horizontal support base or completing an extended corrective pullback. When candles cleanly cross above the indicator’s middle band, the market transitions into the upper channel, signaling bullish control.
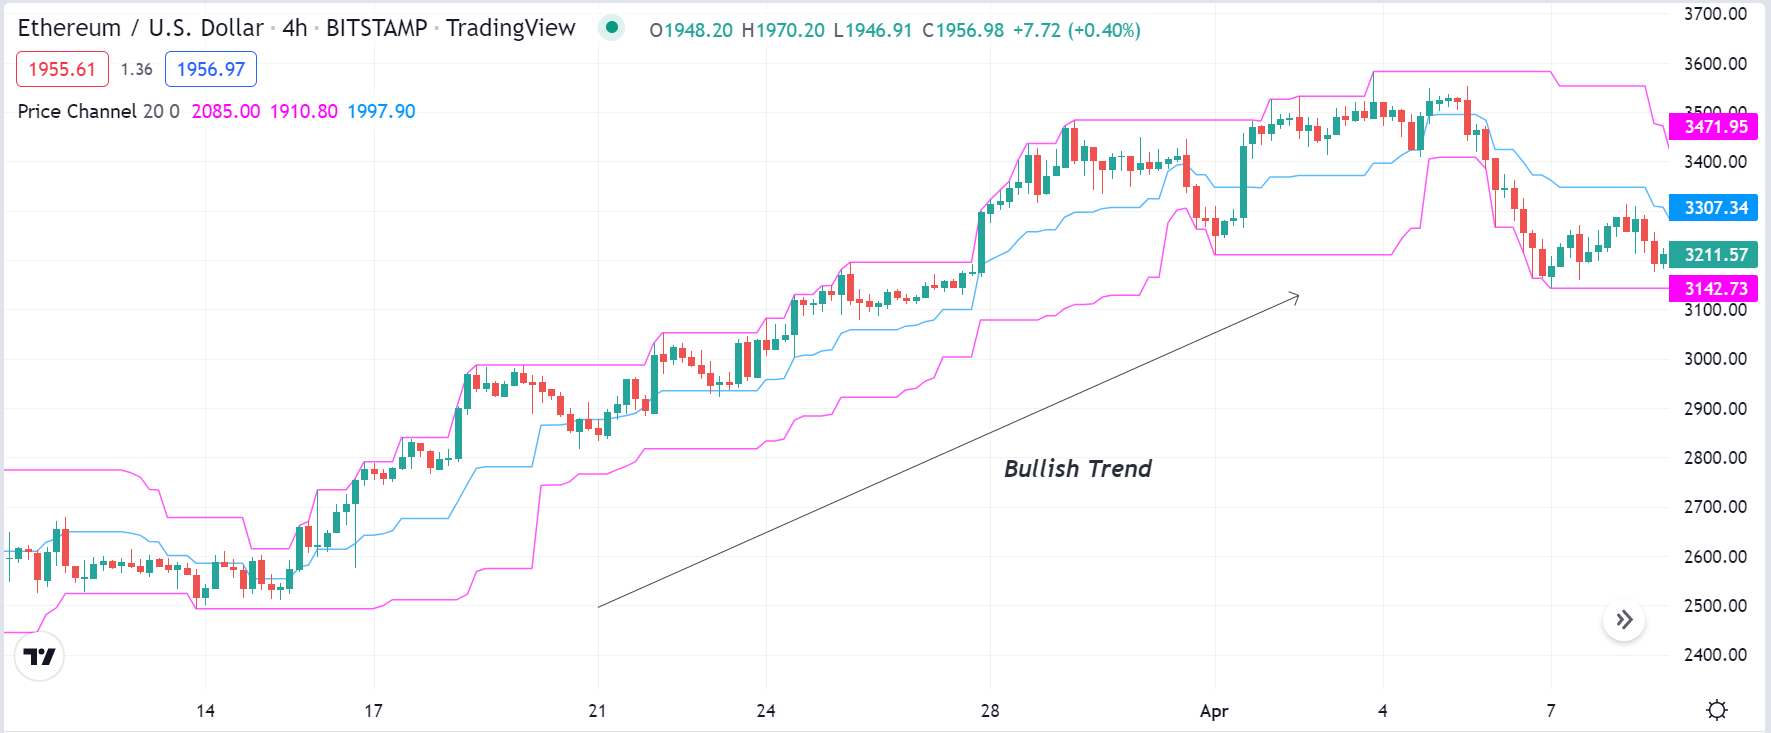
Price channel indicator showing candlestick breakout above mid-band into upper channel
Figure 1: Bullish channel transition—candle closes decisively above the mid-band baseline to activate long entries.

Trade Management Protocol:

Place the protective stop-loss just beneath the recent swing low or below the mid-band. As the price pushes toward the upper channel boundary and prints a new higher-high, trail your stop to break-even to secure risk-free exposure.

Tip 2: Catching Downtrends and Short Entries

When an asset fails to punch through major overhead resistance and loses upside momentum, monitor the middle channel band. A decisive candle close below the mid-band confirms that sellers have seized control, opening the way for a test of the lower boundary.
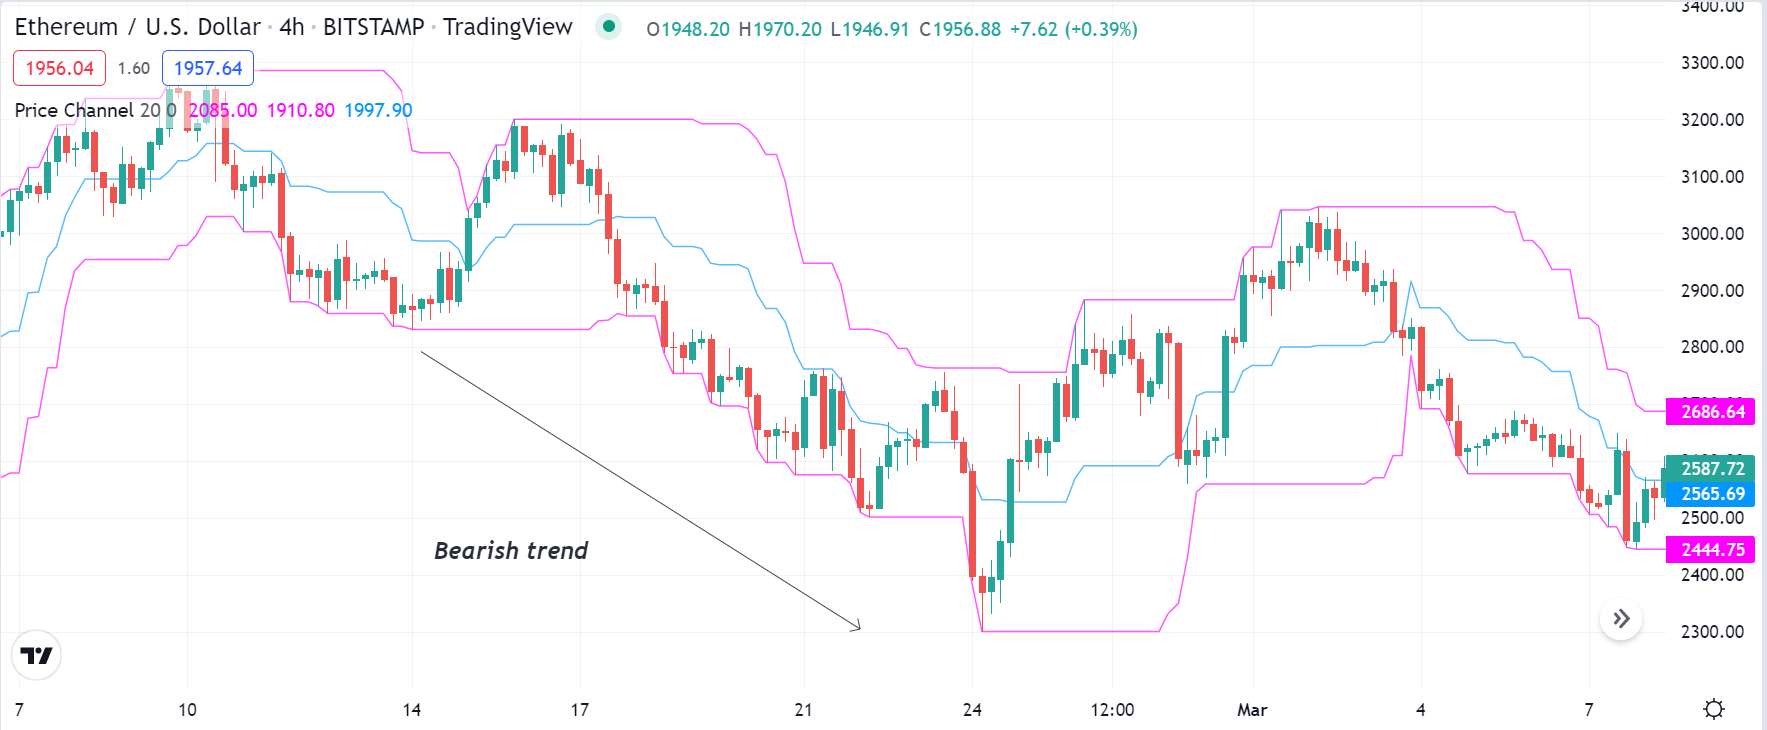
Price channel indicator showing price rejection at resistance and breakdown below mid-band
Figure 2: Bearish breakdown setup—rejection at upper resistance followed by breakdown into the lower channel.

Execution Rule: Enter short upon the mid-band breakdown confirmation candle. Maintain the short position as long as price remains suppressed inside the bottom channel beneath the descending mid-band.

Tip 3: Detecting Sideways Compression and Avoiding Whipsaws

Much like the famous Bollinger Band squeeze, the Price Channel’s upper and lower bands converge tightly toward each other during periods of low volume and indecision. Recognizing this visual pattern prevents costly chop trading.
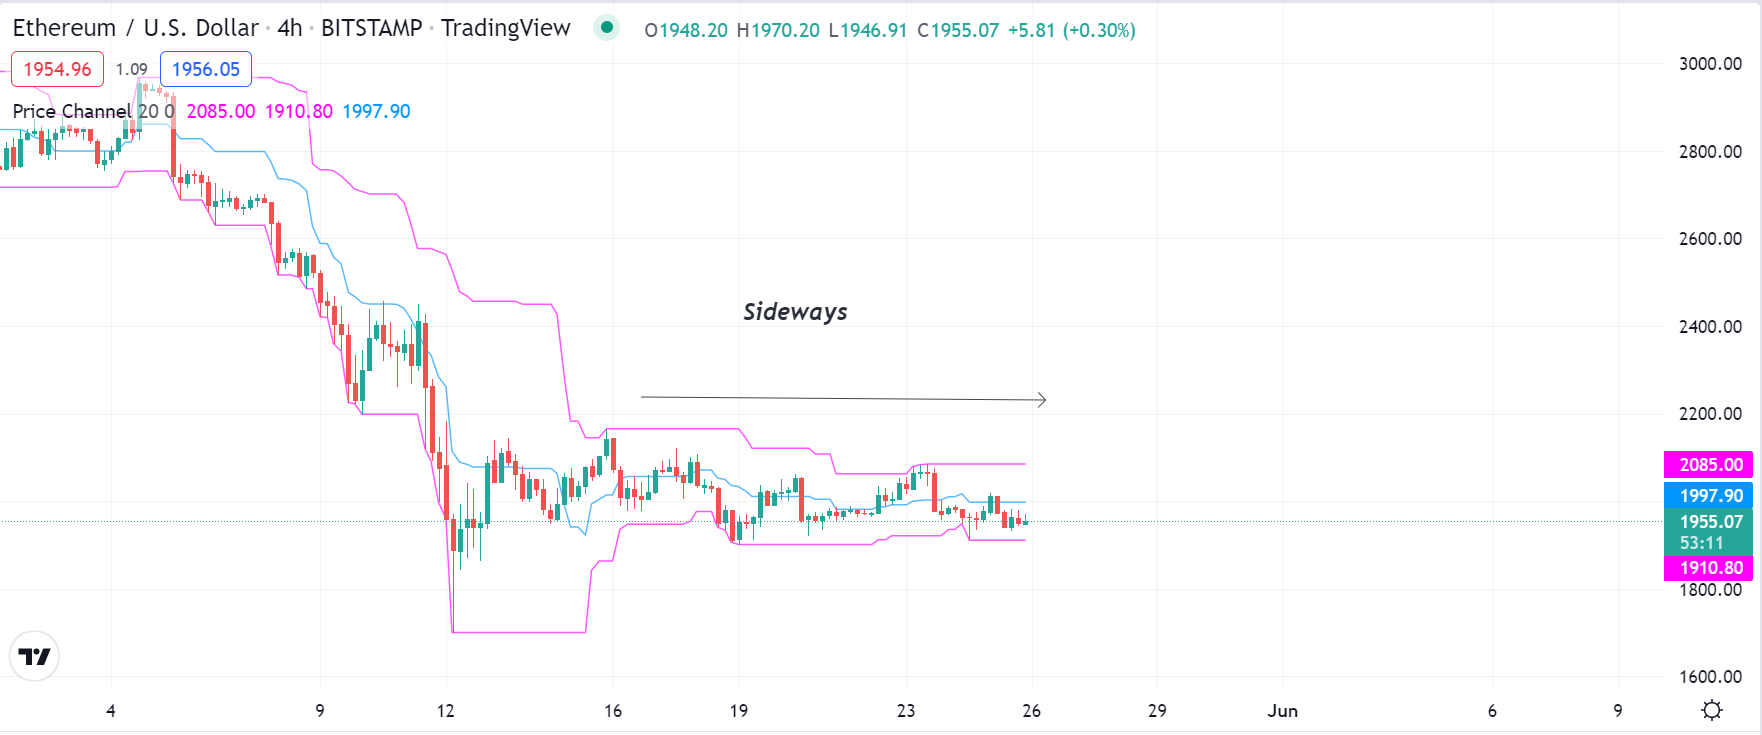
Price channel bands converging tightly during low volatility consolidation phase
Figure 3: Rangebound squeeze—converging channel bands signal severe liquidity compression prior to expansion.

Pro Tip:

Never trade mid-band bounces inside a narrow squeeze. Instead, wait for a decisive expansion breakout where the outer bands expand outward and candles ride the trending boundary.

Tip 4: Validating Channel Breakouts with Volume

False breakouts are common in crypto markets due to stop hunts. By combining the Price Channel with an on-chart Volume indicator, traders can distinguish institutional accumulation from retail traps.
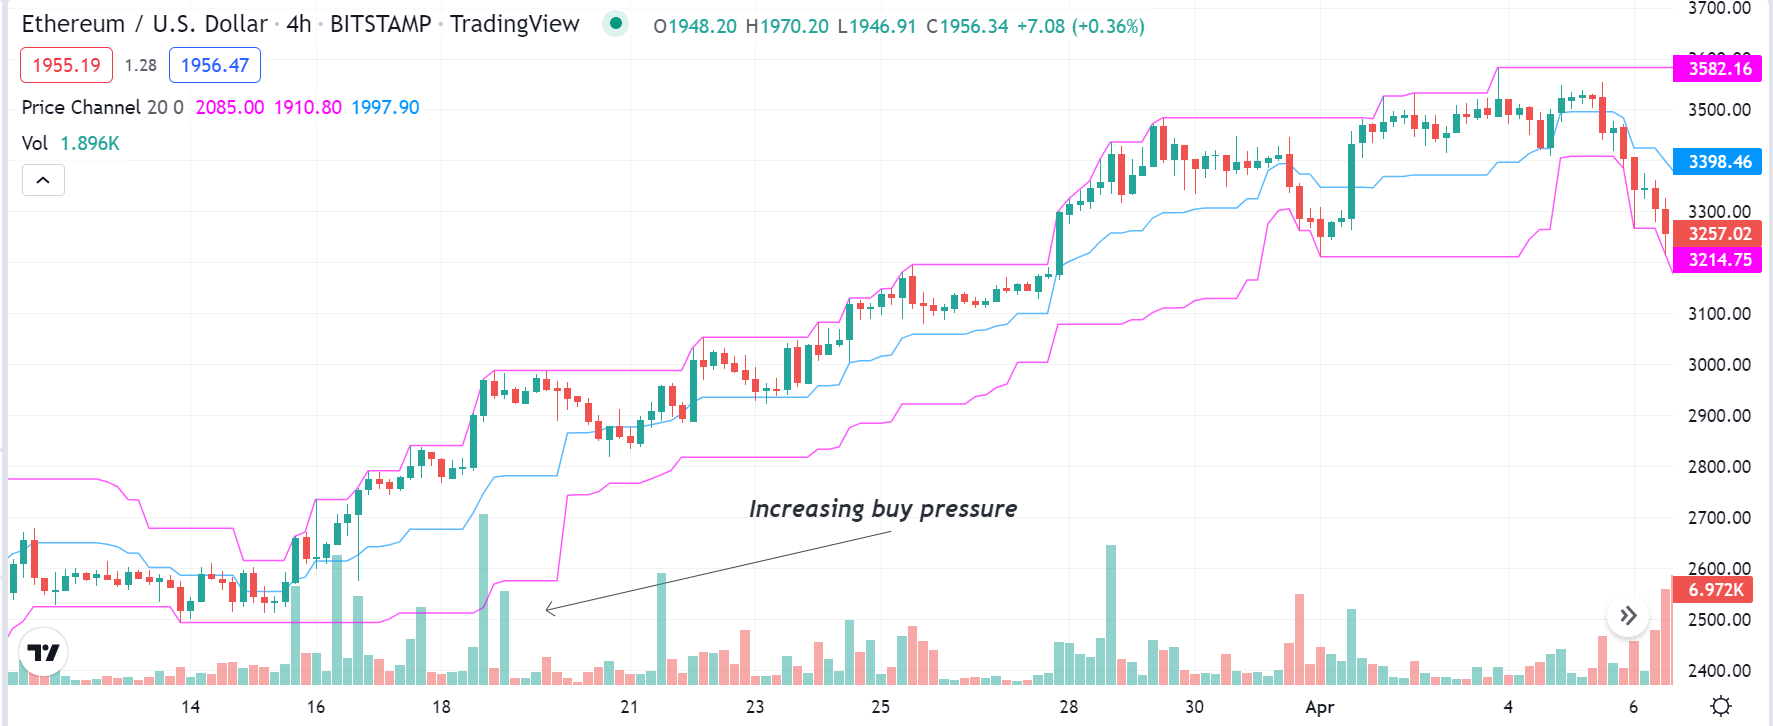
Price channel mid-band breakout confirmed by surging trading volume bars
Figure 4: Volume expansion confluence—channel breakout accompanied by significantly elevated trading volume.

When the price crosses above the middle band while volume bars simultaneously surge above their 20-period moving average, high-conviction buying is confirmed.

Tip 5: Pairing with the Relative Strength Index (RSI)

The 14-period Relative Strength Index (RSI) acts as an indispensable momentum filter. When looking to execute short positions, confirm that the RSI dynamic line heads downward beneath its 50 centerline at the exact moment the price breaks into the lower channel.
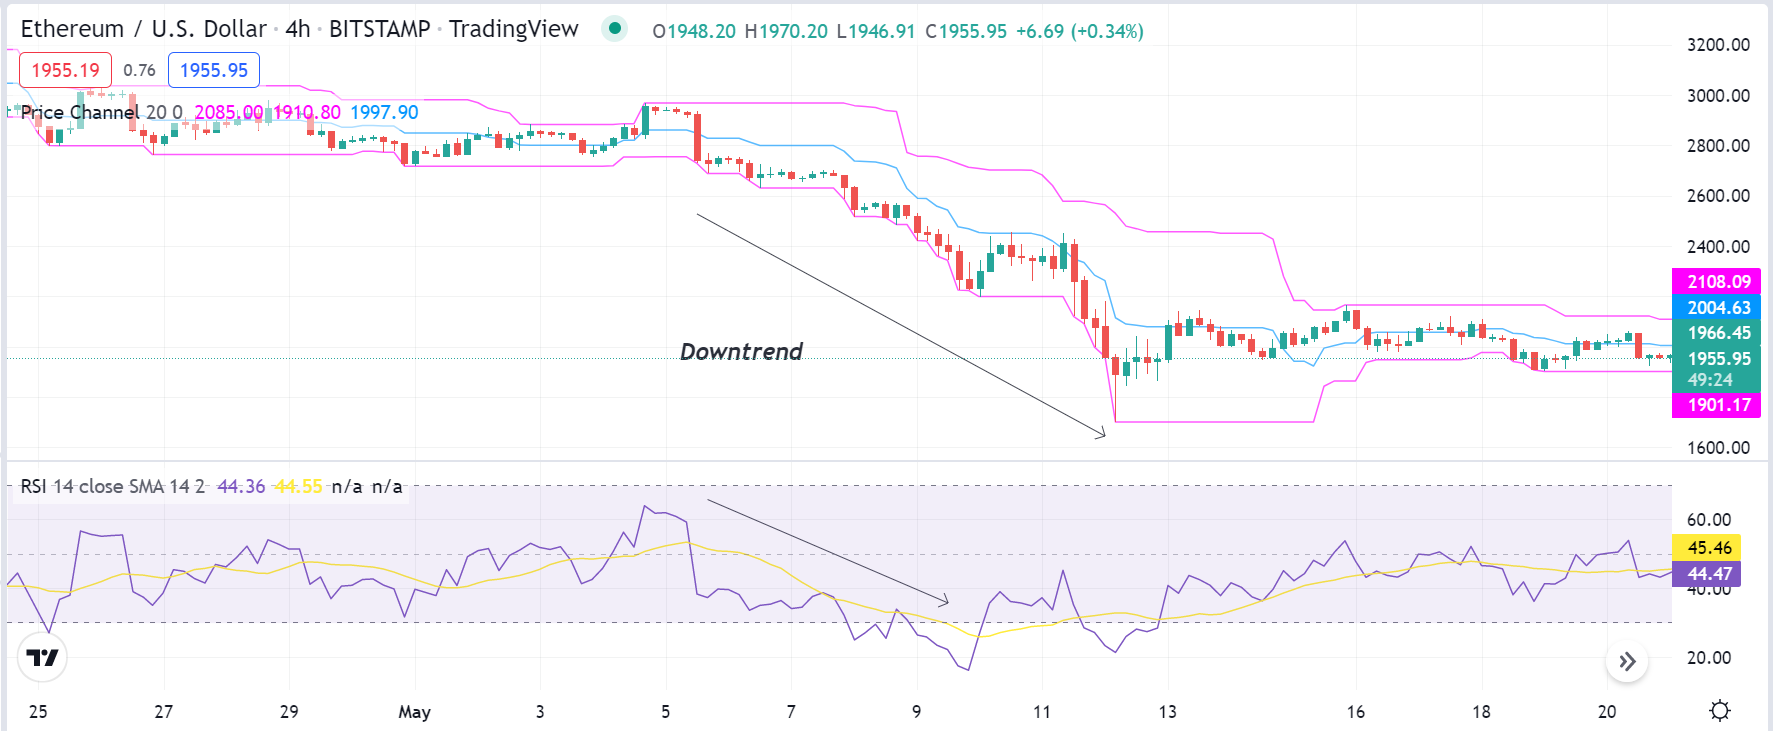
Dual technical indicator setup showing price channel breakdown confirmed by RSI below 50
Figure 5: RSI confluence—price breaks below the mid-band while the RSI line drops below 50 into bearish territory.

The Confluence Edge:

Price channels identify price extremity, while RSI measures underlying velocity. Synchronizing both technical models eliminates false trend starts and sharpens entry accuracy.


Summary Matrix: Price Channel Strategy Playbook

Market Phase Channel Position Volume / RSI Trigger Trade Setup Profit Target
Bullish Swing Crosses above Mid-Band Volume > Average / RSI > 50 Buy Long Upper Channel Band / +2R
Bearish Breakdown Crosses below Mid-Band Volume Spikes / RSI < 50 Sell Short Lower Channel Band / Support
Range Compression Bands squeeze tightly together Volume drying up / RSI near 50 Stand Aside / Prepare Breakout N/A (Wait for expansion)
Trend Continuation Price rides Upper Band Sustained high volume / RSI 60-70 Hold Long / Trail Stops Trail stop along Mid-Band

Conclusion

The Crypto Price Channel strategy is an intuitive yet mathematically sound methodology for navigating volatile crypto trends. By adhering to mid-band triggers, filtering entries with volume and RSI, and steering clear of narrow band squeezes, traders can achieve a consistent edge across all timeframes.


Risk Disclaimer: Cryptocurrency and derivatives trading entails high financial risk. Past performance of technical indicators does not guarantee future results. Practice proper risk management and never risk more than you can afford to lose.
Share76Tweet47Pin17Share13

Related Posts

Crypto correlation trading strategy featuring cross-asset price trajectories between Bitcoin and S&P 500 with matrix heatmap
blog

Crypto Correlation Strategy: Top 5 Tips to Maximize Portfolio Profits

November 15, 2026
1.5k
Greedy Crypto Trading Strategy showing high-tech cryptocurrency chart with candlestick gaps and Hull Moving Average
blog

Greedy Crypto Strategy: Top 5 Tips to Trade Candlestick Gaps

November 15, 2026
1.5k
VIX Trading Strategy analysis showing financial candlestick charts and Cboe volatility momentum oscillator
blog

VIX Trading Strategy: Top 5 Tips to Profit from the Cboe Volatility Index

November 15, 2026
1.5k
Load More
  • Trending
  • Comments
  • Latest
How to Buy US Stocks From Bangladesh, India & Pakistan- ForexPipsClub Investment Guide

How to Buy US Stocks From Bangladesh, India & Pakistan- ForexPipsClub Investment Guide

February 5, 2024
A US Recession: Surprising Benefits for the Market, According to Strategists

A US Recession: Surprising Benefits for the Market, According to Strategists

May 26, 2023
Apple Inc. Opened Its Store In India: Is It A Good Decision?

Apple Inc. Opened Its Store In India: Is It A Good Decision?

April 19, 2023
Tether to Set Up Bitcoin Mining Operation in Uruguay Using Renewable Energy

Tether to Set Up Bitcoin Mining Operation in Uruguay Using Renewable Energy

June 5, 2023
NIO Stock Forecast: Should You Buy Nio Stock Now?

NIO Stock Forecast: Should You Buy Nio Stock Now?

0
The Trend Navigator Strategy for MT4

The Trend Navigator Strategy for MT4

0
USD Strength Will Dominate The Market- Says Wells Fargo

USD Strength Will Dominate The Market- Says Wells Fargo

0
3 Black Crows Candlestick Pattern: How To Trade It

3 Black Crows Candlestick Pattern: How To Trade It?

0
Crypto correlation trading strategy featuring cross-asset price trajectories between Bitcoin and S&P 500 with matrix heatmap

Crypto Correlation Strategy: Top 5 Tips to Maximize Portfolio Profits

November 15, 2026
Crypto Price Channel Strategy chart illustrating dynamic channel bands with upper resistance, mid-band, and lower support

Crypto Price Channel Strategy: Top 5 Tips to Master Dynamic Ranges

November 15, 2026
Greedy Crypto Trading Strategy showing high-tech cryptocurrency chart with candlestick gaps and Hull Moving Average

Greedy Crypto Strategy: Top 5 Tips to Trade Candlestick Gaps

November 15, 2026
VIX Trading Strategy analysis showing financial candlestick charts and Cboe volatility momentum oscillator

VIX Trading Strategy: Top 5 Tips to Profit from the Cboe Volatility Index

November 15, 2026
Forex Pips Club

Copyright © 2022 Forex Pips Club. All Rights Reserved.

Forex Pips Club

  • About Us
  • Contact Us
  • Privacy Policy
  • Terms and Conditions
  • About Us

Follow Us

No Result
View All Result
  • About Us
  • Broker Review
  • Contact Us
  • Crypto Review
  • Economic Calendar
  • FAQ
  • Forex News
  • Home
  • Privacy Policy
  • Prop Review
  • Terms and Conditions

Copyright © 2022 Forex Pips Club. All Rights Reserved.

Welcome Back!

Login to your account below

Forgotten Password?

Retrieve your password

Please enter your username or email address to reset your password.

Log In

Add New Playlist