What is the best way to trade volatility across financial and crypto markets? Understanding how sentiment shifts during extreme swings can turn turbulence into high-probability trading opportunities. Here are the top five professional tips to master the Cboe Volatility Index (VIX) trading strategy.
i Key Trading Takeaways
- Sentiment Barometer: The Cboe Volatility Index (VIX) tracks market fear and institutional hedging demand, serving as a leading momentum indicator.
- Histogram Mechanics: Green bars below the zero line reflect bullish participation and buyer confidence, while red bars above signal panic and selling pressure.
- Confluence is Essential: Never trade the VIX in isolation; combine signals with key support/resistance levels, Bollinger Bands, and the Relative Strength Index (RSI).
- Capital Preservation: Trail stop-losses to break-even once new swing highs/lows print to guard against violent mean-reversion spikes.
Understanding the VIX Momentum Indicator
The Market Volatility Index (VIX)—often dubbed Wall Street’s “fear gauge”—is one of the most widely followed metrics among institutional investors. Originally developed by the Chicago Board Options Exchange (Cboe) to quantify 30-day implied volatility derived from S&P 500 options, the underlying concept has been adapted into multi-timeframe (MTF) momentum oscillators for equity indices, forex, and cryptocurrency markets.
In modern charting platforms, the VIX momentum indicator plots in an independent window beneath the primary price chart. It features color-coded histogram bars distributed across a central zero baseline:
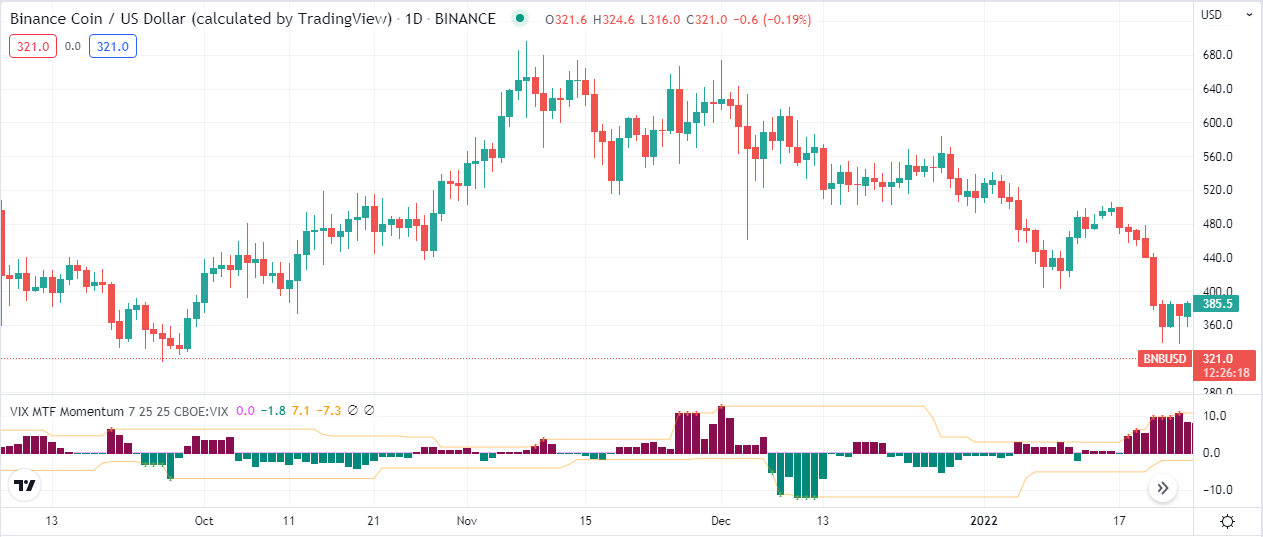
The size and trajectory of these histogram bars dynamically scale according to relative buying and selling volume:
- Bars Above the Central Line (Red): Highlight escalating fear, panic selling, and institutional downside protection. Asset prices typically experience downward pressure or aggressive corrective waves in this phase.
- Bars Below the Central Line (Green): Signal building investor confidence, risk-on participation, and dominant spot accumulation. Prices frequently embark on sustained bullish expansions.
Top 5 Tips for Executing the VIX Trading Strategy
To extract reliable alpha from volatility metrics, traders must adhere to structured rules rather than blindly reacting to color shifts. Below are the five tactical guidelines employed by seasoned market participants.
Tip 1: Timing Bullish Reversals at Support (Buy Setup)
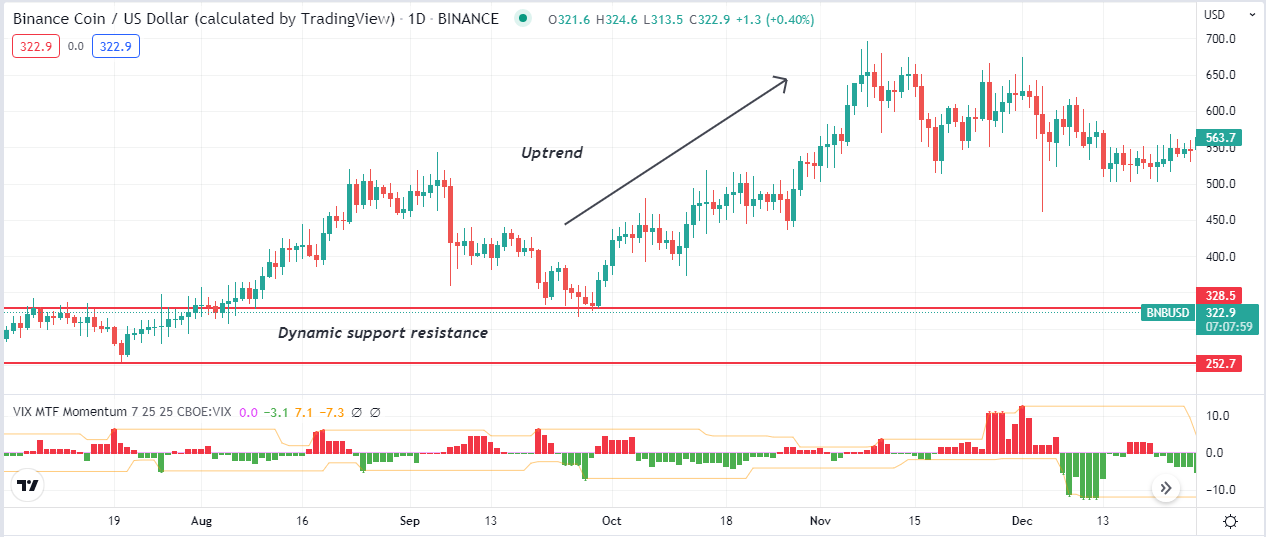
High-probability long entries materialize when a market tests a recognized support zone or decisively reclaims a key structural floor. As price stabilizes, monitor the VIX oscillator for an exhaustion of upper red bars and the emergence of fresh green bars printing below the zero line.
Why This Setup Works:
When an asset reaches major demand, sellers fail to push lower prices, leading to short-covering. The VIX indicator detects this influx of buy volume, printing green bars below the zero line to indicate that panic has dissipated and buyers hold the upper hand.
Execution & Risk Control: Enter on candle close confirmation above the bounce level. Place invalidation stop-losses just below the swing low. Target the nearest overhead resistance or supply block for partial profit-taking.
Tip 2: Capitalizing on Bearish Breakdowns at Resistance (Sell Setup)
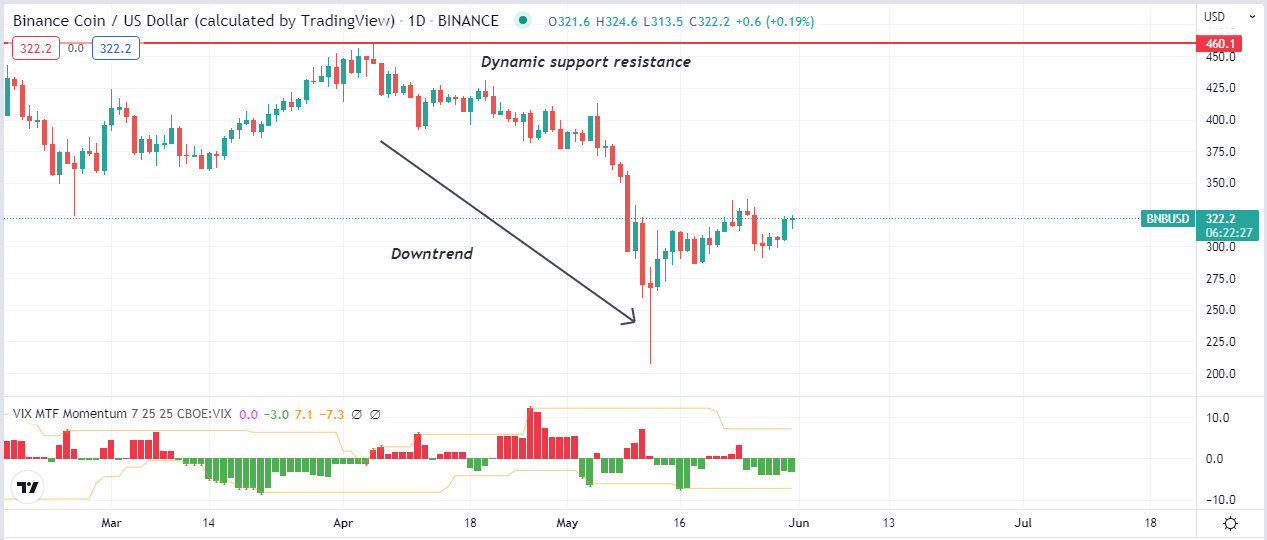
Short positions offer lucrative risk-reward ratios when price exhausts into heavy overhead resistance or breaches a long-standing support baseline. When candlestick wicks show clear upper rejection while the VIX oscillator fires aggressive red histogram bars above the zero line, downward momentum is validated.
Why This Setup Works:
Rejection at resistance triggers institutional hedging. Options desks purchase downside puts, spiking volatility. The resulting red histogram surge warns that market participants are de-risking rapidly, opening the path for a steep drop.
Execution & Risk Control: Position initial profit targets directly above the preceding support cluster. As price forms a new lower-low, trail stops to break-even or behind the most recent lower-high to eliminate downside risk.
Tip 3: Detecting Sideways Markets and Rangebound Traps
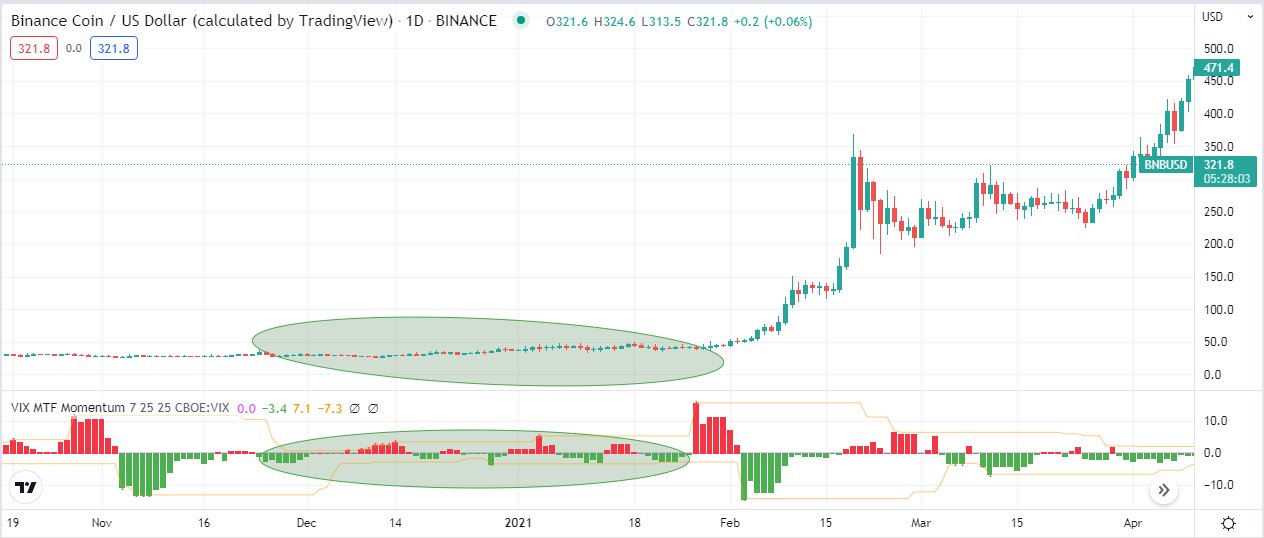
One of the most valuable capabilities of the VIX indicator is identifying low-volatility regimes where trend-following strategies fail. When histogram bars shrink in size, contract toward the zero baseline, and rapidly alternate colors without directional follow-through, the market has entered an indecisive consolidation phase.
How to Avoid Costly Whipsaws:
During contracted sideways ranges, avoid opening breakout trades prematurely. Squeezed volatility is typically a precursor to explosive expansion. Professional traders sit in cash or trade strictly range boundaries with reduced sizing until a clear directional impulse develops.
Tip 4: Catching High-Velocity Breakouts with Bollinger Bands
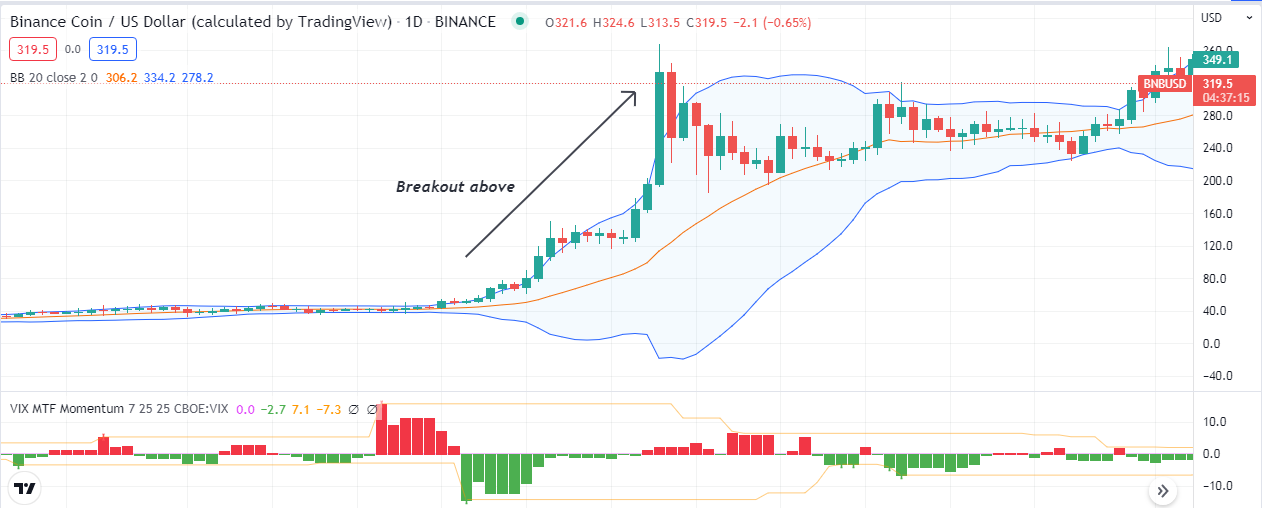
Pairing the VIX indicator with volatility envelope tools like Bollinger Bands (20, 2) creates a lethal framework for trading momentum breakouts. When price has coiled within tight bands and then pierces the upper envelope while the VIX simultaneously generates robust green bars below the zero line, a genuine trend expansion has begun.
Breakout Confirmation Protocol:
- Ensure the asset underwent a noticeable Bollinger Band squeeze prior to the move.
- Wait for a full candle body to close outside the band—do not chase intra-bar wicks.
- Verify multi-timeframe alignment (e.g., ensure the 4-hour trend matches the 1-hour breakout signal).
Tip 5: Building Confluence with the Relative Strength Index (RSI)
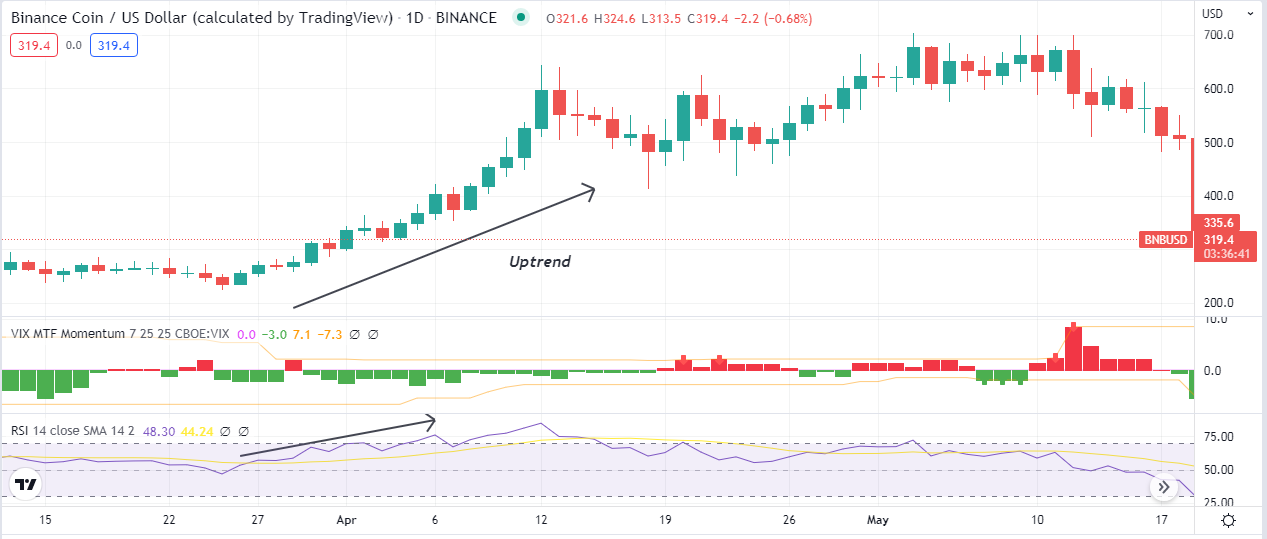
No single indicator should dictate capital deployment. Combining the VIX momentum indicator with the 14-period Relative Strength Index (RSI) yields a dual-filter system that eliminates false positives. Look for instances where the RSI dynamic line crosses above its 50 centerline at the exact moment the VIX expands green bars below the zero mark.
The Confluence Advantage:
While the VIX captures volume intensity and market sentiment shifts, the RSI measures pure internal velocity. When both independent mathematical calculations agree on direction, the likelihood of an extended trend move increases significantly.
Summary Matrix: VIX Signal Matrix Across Market Regimes
Conclusion: Mastering Volatility for Long-Term Edge
Volatility is often feared by novice traders, but for disciplined professionals, it represents the very engine of profitability. The Cboe Volatility Index (VIX) and its multi-timeframe momentum variants demystify market mechanics by providing an objective lens into underlying sentiment and institutional positioning.
By applying these five essential tips—timing structural bounces, shorting fear cascades, respecting sideways regimes, confirming breakouts, and anchoring signals with RSI confluence—you establish a robust, repeatable strategy tailored for both crypto and traditional financial markets. Master these dynamics in a demo environment before committing real capital, and let volatility work for your portfolio rather than against it.