ATR Filtered Strategy is volatility and trend following strategy based on some volatility and trend identifying indicators. Although this is a suitable strategy for all kinds of financial instruments, this strategy gives the best outcome with high volatile assets. This trading system is straightforward to use as it shows all details like a trend, volatility, range, spread, candle time of the asset at once. All kinds of traders with some basic and obvious knowledge of trading can easily use it and get accurate trading positions to enter and exit with profit from this strategy.
📌 Strategy Summary & Key Parameters
- Strategy Name: The ATR Filtered Strategy For MT4
- Platform: MetaTrader 4 (MT4)
- Trading Style: Trend Following & Momentum Breakout
- Recommended Timeframes: M15, H1, H4, Daily
- Recommended Asset Classes: Major & Cross Currency Pairs (EUR/USD, GBP/USD, USD/JPY, EUR/JPY, GBP/JPY)
- Core Technical Tools: MetaTrader 4 Technical Indicators
- Risk Management: 1% to 2% risk per trade with 1:1.5+ Risk-Reward Ratio
ATR Filtered Strategy
This strategy applies to the MetaTrader 4 platform and needs some custom-made indicators or tools. With appropriate use, this might be an unbeatable strategy. Before getting details about this strategy, let’s have a look at trading preconditions for this strategy:

- Currency pairs: All Forex (Major and cross pairs), Cryptocurrencies, stock market indices, shares.
- Timeframes: 15 min or higher.
- Trading sessions on stock market indices: 2:00 – 22:00 GMT- Berlin.
Let’s have a look at Metatrader 4 indicators/tools used in this strategy:
- ATR Mastic Sc
- Trender H
- Market Panel
- Begashole trend indicator
- Barbarian Arrow (11 periods)
- ATR Mastic A
After applying all these tools at MT4, the chart will look like this:
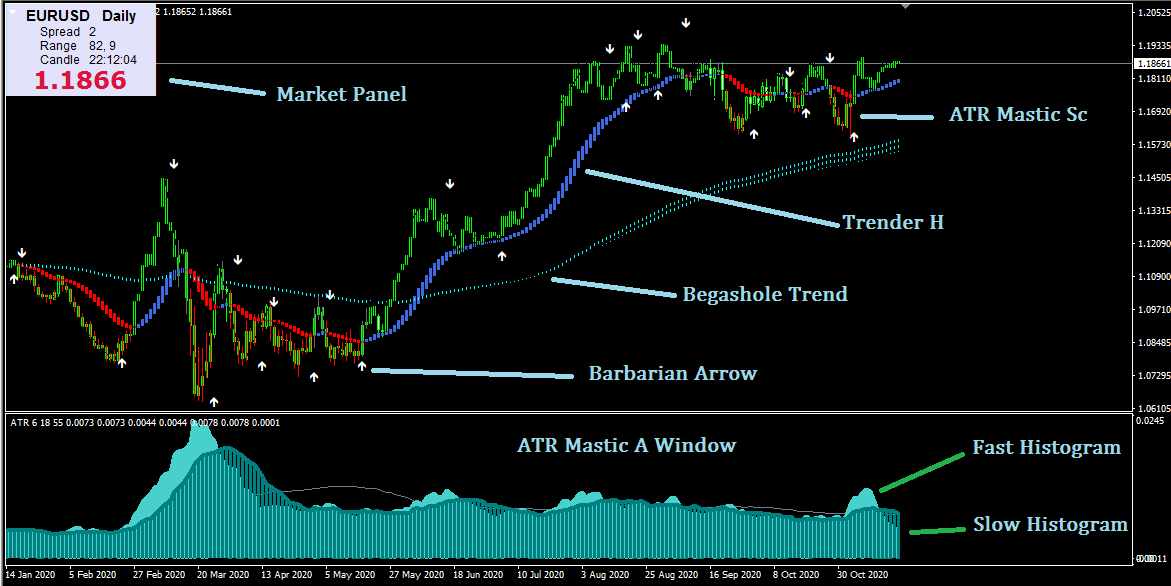
ATR Mastic Sc is point bars made different colors on candles as the market moves. Green bars when it’s an uptrend and red bars on the downtrend market.
Trender H is a trend indicator with two different colors to identify the market movement. When price crosses Trender H, it's a bullish sign for the asset, so bars of this indicator turns blue, and if price crosses below, then bars will be red.
Market Panel shows details about the assets like Spread, Range, Candle time, and even sessions (in lower time frames).
Begashole trend indicator is a custom made indicator based on some specific EMA (Exponential Moving Average) period and optional for this strategy. Price crosses upside of Begashole trend indicator it declares bullish, and on the downside, it indicates a bearish price movement.
Barbarian Arrow is filtered in trend and with volatility and creates arrow signs when market shifts or volatility of the asset get changed. This indicator’s signal arrows are in slow configuration, different from the setting with binary options trading.
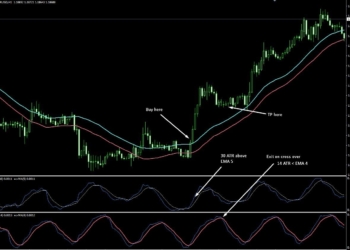
ATR Mastic A is a customized ATR indicator formed by two histograms. When the fast Histogram of ATR is above the slow histogram, it indicates that the asset’s volatility is good to enter the market. This customized indicator also can be used in other trend-following strategies or with trend indicators as filters.
ATR Filtered Strategy shows all possible details for the asset's condition about volatility and trend directions after applying all MetaTrader 4 terminal tools. Although this strategy applies to all kinds of forex currency pairs, Cryptocurrencies, stock market indices, shares, and time frame must be 15 min or higher. This strategy provides the best outcome with high volatility assets.
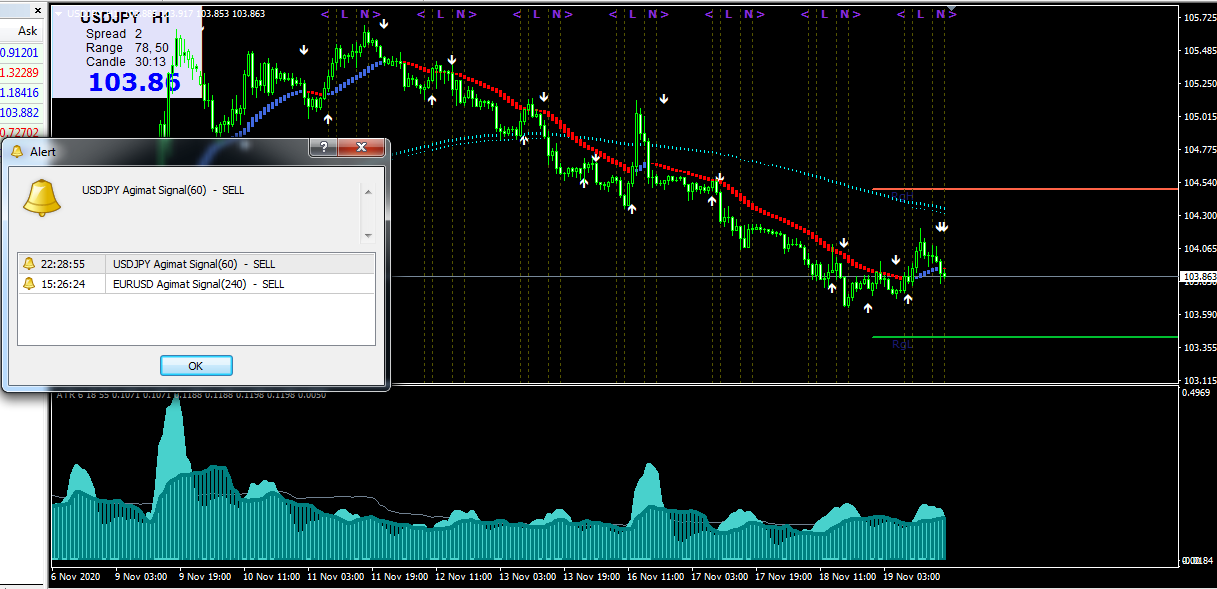
After applying all this at Metatrader 4 platform, ATR Filtered Strategy will send alerts when this trading system sorts out the market movement shifts and opportunities.
Bullish Trading Strategy
- Assets price is above Trender H (crosses blue bars).
- Price crosses above Begashole trend indicator. (This is an optional condition).
- Barbarians by arrows shown up.
- ATR Mastic Sc paint bars will be in green color.
- ATR Mastic A fast histogram > Slow histogram. (Indicates good volatility).
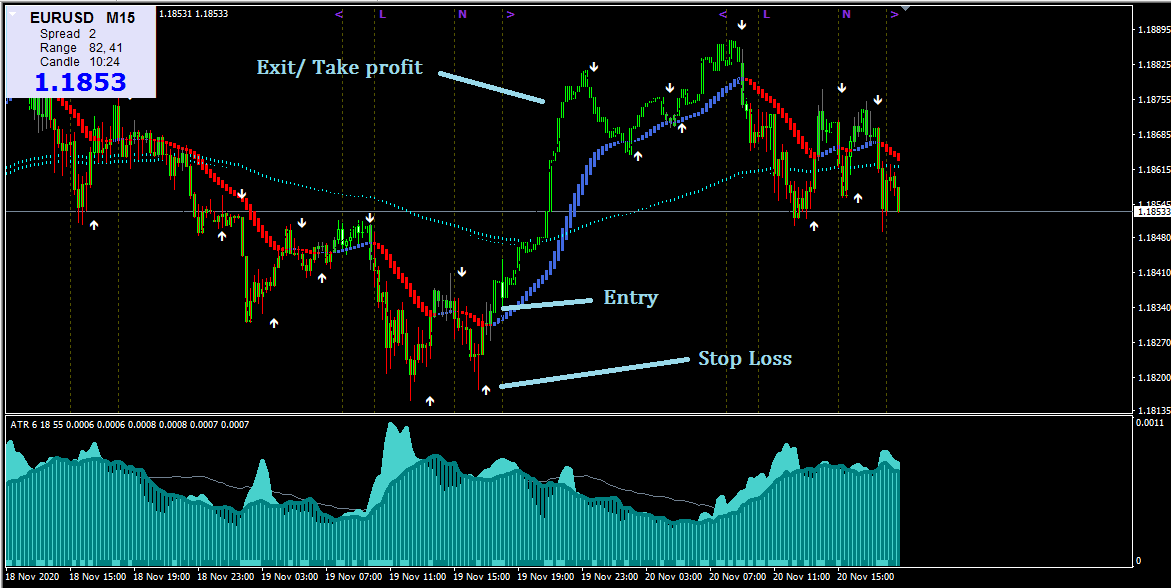
Entry
If it completes all trading conditions, check out time (between 2:00 – 22:00 GMT- Berlin) and wait for the running candle to close and enter as soon as another bullish candle appears.
Stop Loss
The initial stop will be placed below the recent swing low. (may shift it to the upside above the signal bar with some more positive market movement and other confirmations).
Take Profit
The risk ratio for this strategy is 1:1.18. But with the mindset of small profit and being with the market for a little more time, this could be a more profitable strategy than average.
Bearish Trading Strategy
- Assets price is below Trender H (crosses red bars).
- Price crosses below the Begashole trend indicator. (This is an optional condition).
- Barbarian sell arrow shown up.
- ATR Mastic Sc paint bars will be in red.
- ATR Mastic A fast histogram > Slow histogram. (Indicates good volatility).
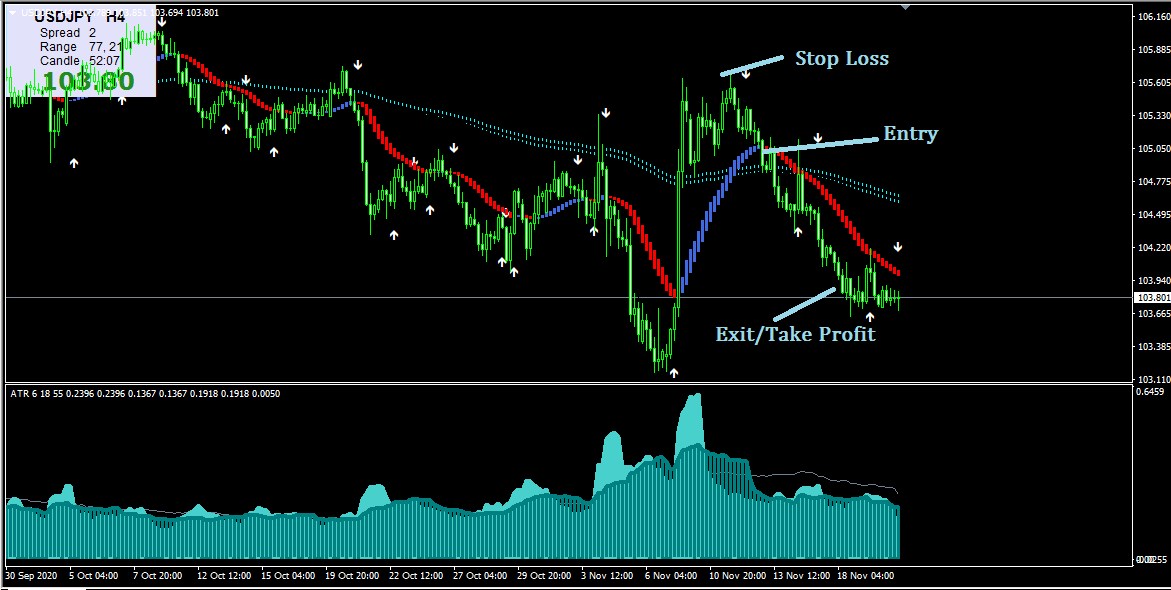
Entry
If it completes all trading conditions, check out time (between 2:00 – 22:00 GMT- Berlin) and wait for the running candle to close and enter as soon as another bearish candle appears.
Stop Loss
The initial stop will be placed above the recent swing high. (may shift it to the downside below the signal bar with some more negative market movement and other confirmations).
Take Profit
The risk ratio for this strategy is 1:1.18. But with the mindset of small profit and being with the market for a little more time, this could be a more profitable strategy than average.
💡 Professional Execution Tip:
Always wait for the trigger candlestick to fully close before entering a market position. Entering prematurely during an open candle frequently results in false breakouts and wick traps. In addition, avoid opening new positions during high-impact macroeconomic releases (e.g., US Non-Farm Payrolls or CPI announcements) when spread spikes and slippage can distort indicator signals.
Conclusion
This strategy is based on the two most basic indicators that measure market volatility and identify trends and is suitable for all kinds of financial instruments to be an unbeatable trading strategy for all levels of traders (like beginners to pros). In this trading strategy, trade management is an important part. Although it’s a strategy with a risk ratio of 1:1.18, it could be more profitable by trading management, in other words, by shifting take profit and stop loss above or below the signal bars.
It’s better to avoid assets-related trend-changing news (like avoiding USD corresponding pairs at Fed meeting minutes, NFP, etc. news day) and make sure all conditions are fulfilled before taking entry. As ATR Filtered Strategy works on time frames 15 min or higher, smart traders must check trend validity from higher time frames for more accuracy before placing orders. 2:00 – 22:00 GMT- Berlin is the trading session for trading stock market indices by this strategy because of good volatility and to get better trading results, it requires to have an excellent volatile asset by this trading system.
🔗 Recommended Related Strategies & Indicator Guides
- Best Indicators for Swing Trading Guide: Learn how to optimize essential technical tools for multi-day swing positions on active market charts.
- VIX Trading Strategy Guide: Master hedging volatility and market sentiment swings for higher accuracy setups.
- The ATR Trend Strategy For MT4: Discover complementary rules and indicator setups to enhance your trading edge.
- The Bollinger Bands and SVE Bollinger Bands Trading System For MT4: Explore alternative entry triggers and exit management for MT4 traders.
⚠️ Risk Warning: Foreign exchange and CFD trading carries a high level of risk to your capital and may not be suitable for all investors. Leverage can work against you as well as for you. Before deciding to trade foreign exchange, carefully consider your investment objectives, level of experience, and risk appetite. Never risk money you cannot afford to lose, and always thoroughly backtest trading strategies on a demo account before risking live capital.