The Bollinger Bands and CCI Reversal Trading System for MT4 is an easy use trading system for short term traders based on Bollinger bands and two types of CCI indicator (one on the chart and one below the chart or as an indicator window). This strategy is applicable for all kinds of currency pairs (Major or cross) at time frames 60 min or higher. This trading system is basically a trend following strategy that works on uptrend or downtrend market movement.
📌 Strategy Summary & Key Parameters
- Strategy Name: The Bollinger Bands and CCI Reversal Trading System For MT4
- Platform: MetaTrader 4 (MT4)
- Trading Style: Trend Following & Momentum Breakout
- Recommended Timeframes: M15, H1, H4, Daily
- Recommended Asset Classes: Major & Cross Currency Pairs (EUR/USD, GBP/USD, USD/JPY, EUR/JPY, GBP/JPY)
- Core Technical Tools: in this strategy:, * Bollinger bands (20, 2), * CCI indicator arrow (14 periods on the chart), * CCI indicator (14 perio
- Risk Management: 1% to 2% risk per trade with 1:1.5+ Risk-Reward Ratio
The Bollinger Bands and CCI Reversal Trading System For MT4
This strategy uses the two most well tools to identify trends and volatility named Bollinger bands and CCI (commodity channel index). Anyway, this trading system is made for short term trade but very easy to apply.

Bollinger bands use three bands to identify market volatility and range. When price touches or crosses the upper band that indicates it's an overbought condition for the asset and if the price touches or crosses the lower band it represents an oversold situation by these tools. It can also be used as a volatility identifier by its representation on the chart. If the price faces some support or resistance level or market movement gets slower (also known as consolidating phase), the bands of Bollinger Bands get closer, and for a volatile or fast movement of price, the bands get wider. Using only Bollinger bands to identify trading positions is not very recommended as this indicator just focuses only on asset volatility and the range of certain periods while ignoring many other facts that might cause price movements.
CCI (Commodity channel index) is an indicator that tracks the market movement that calculates price for a particular term and shows relative buy or sell signal at different time frames. Usually, traders use this tool on Long term timeframe charts to identify their positions at short term time frames. It’s very easy to identify the dominant trend by CCI by applying it at multiple time frames.
Bollinger Bands and CCI Reversal Trading System is a Bollinger Bands Reversal Strategy. Tools and conditions for this Trading System:
- This system is applicable to 60 min or higher time frames.
- Currency Pairs: Any major or cross pairs.
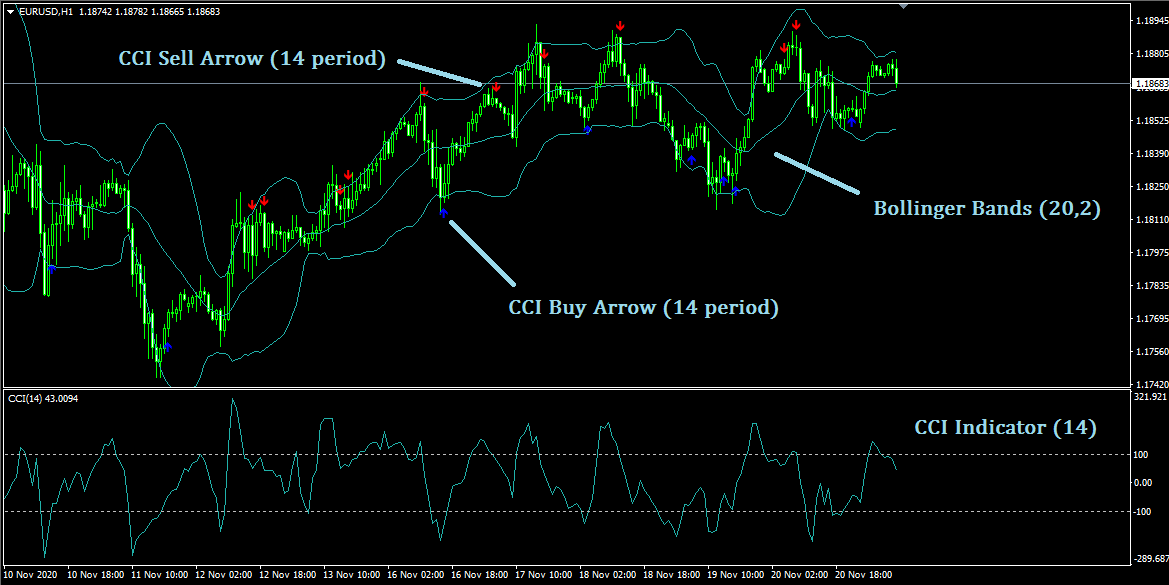
Let's have a look at the Indicators used in this strategy:
- Bollinger bands (20, 2)
- CCI indicator arrow (14 periods on the chart)
- CCI indicator (14 periods below the chart)
Let’s have a look at a visual representation of the strategy:

This trading system uses two types of CCI (one on the chart, one on other windows) and Bollinger Band to identify trading positions.
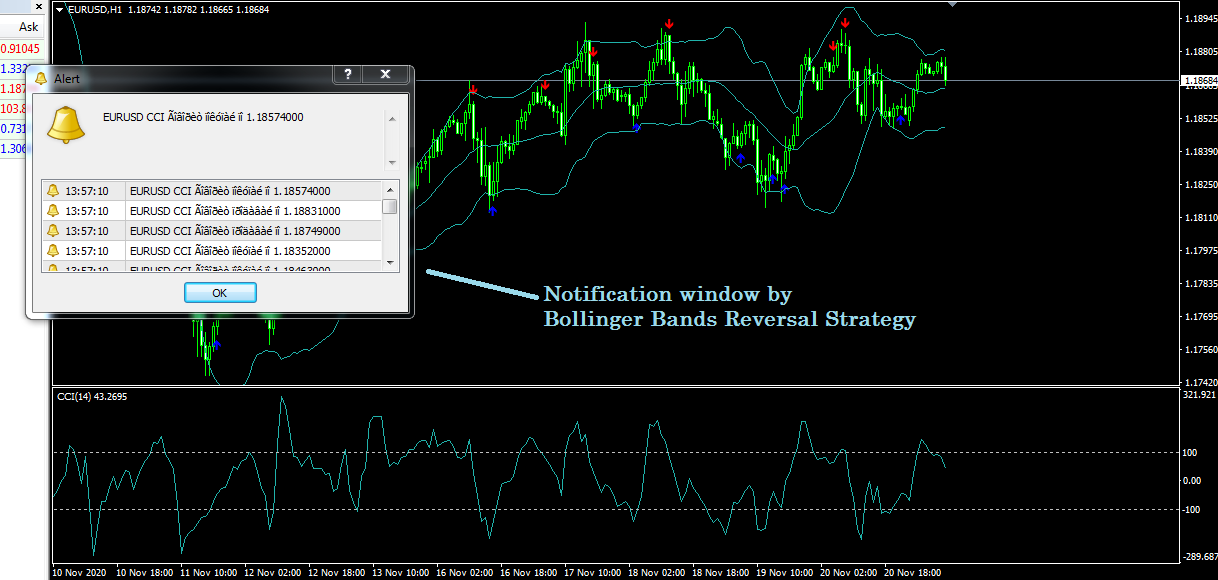
When a buy signal is identified by this trading strategy CCI (on the chart) creates a blue arrow and sends a notification to buy or sell for different time frames.
CCI (14) on independent windows to show the position of buyers and sellers of a certain period at different time frames, price crosses (+100) level that overbought situation and when it's below (-100) asset may oversold. At the (0) level the number of buyers and sellers remains the same.
Bullish Trading Strategy
As history repeats itself price falls down and volatility stops or slower movement price goes back inside bands of Bollinger Bands, touches the middle band, and may continue to move upside to the determined trend from the long term time frame. The 0 line of the CCI indicator below the chart is a breakeven point for the asset as the middle line of the Bollinger band is.
Bullish Trading Conditions
- Green candle followed by a red candle (setup candle) coming into the Bollinger bands.
- CCI crosses above the top red line after closing off the green candle (CCI cross might happen immediately at the close of the green candle that crosses the lower band of Bollinger Bands or up to 1 candle after).
- The CCI buy (blue) arrow appeared on the MetaTrader 4 chart.
Limitations
- If CCI has gone above the zero lines by the close of setup candles do not enter the market.
- If the price is closer to the centerline of Bollinger Bands this trading system suggest s not to make an entry.
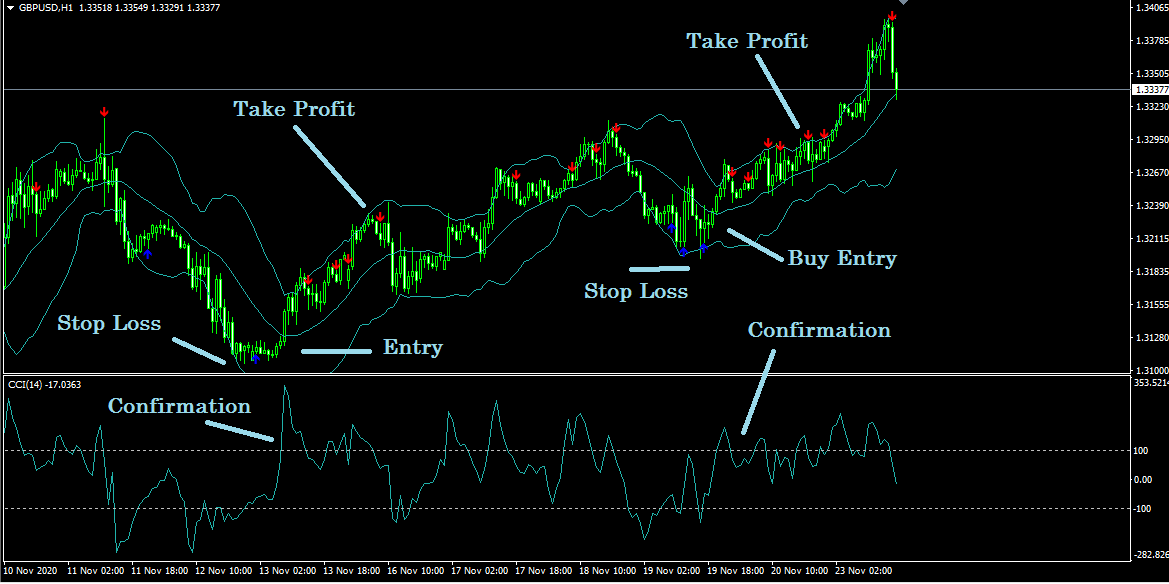
Entry
The green candle appeared after the last red candle outside the bands at the downside. We will wait until the closing of the green candle (It's a sign that the price might go back to bands again) then take buy entry at a suitable price at 60 min chart.
Stop Loss
Initial Stop Loss will be below the previous swing low.
Take Profit
The initial profit target will be 20 pips above the entry or two pips before the middle band. If the price continues to move upwards, take profit or exit from an order may shift before two pips of the upper band.
Bearish Trading Strategy
As history repeats itself, the price remains upside and volatility stops or slower movement price goes back inside bands of Bollinger Bands, touches the middle band, and may continue to move downside to the determined trend from the long term time frame. The 0 line of the CCI indicator below the chart is a breakeven point for the asset as the middle line of the Bollinger band is.
Bearish Trading Conditions
- Red candle followed by a green candle (setup candle) coming into the Bollinger bands.
- CCI crosses below the top red line after closing off the red candle (CCI cross might happen immediately at the close of the red candle that crosses the upper band of Bollinger Bands or up to 1 candle after).
- The CCI sell (Red) arrow appeared on the MetaTrader 4 chart.
Limitations
- If CCI has gone above the zero lines by the close of setup candles do not enter the market.
- If the price is closer to the centerline of Bollinger Bands this trading system suggest s not to make an entry.
Entry
The red candle appeared after the last green candle outside the bands at the upside. We will wait until the closing of the red candle (It's a sign that the price might go back to bands again) then take a sell entry at a suitable price at 60 min chart.
Stop Loss
Initial Stop Loss above the previous swing high.
Take Profit
The initial profit target will be 20 pips below the entry or two pips before the middle band. If the price continues to move downside, take profit or exit from the order may shift before two pips of the upper band.
💡 Professional Execution Tip:
Always wait for the trigger candlestick to fully close before entering a market position. Entering prematurely during an open candle frequently results in false breakouts and wick traps. In addition, avoid opening new positions during high-impact macroeconomic releases (e.g., US Non-Farm Payrolls or CPI announcements) when spread spikes and slippage can distort indicator signals.
Conclusion
In the end, Bollinger as Bands and CCI Reversal Trading System is a short term strategy that could be a profitable strategy by proper use and trade management. It’s a very simple strategy to identify the direction of movement of the market at higher time frames and find out trading positions at lower time frames.
🔗 Recommended Related Strategies & Indicator Guides
- Directional Trend Index (DTI) Strategy: Learn how to optimize capturing early momentum shifts across volatile market conditions on active market charts.
- Best Indicators for Swing Trading Guide: Master essential technical tools for multi-day swing positions for higher accuracy setups.
- The Bollinger Bands and SVE Bollinger Bands Trading System For MT4: Discover complementary rules and indicator setups to enhance your trading edge.
- The Bollinger Bands Scalping System For MT4: Explore alternative entry triggers and exit management for MT4 traders.
⚠️ Risk Warning: Foreign exchange and CFD trading carries a high level of risk to your capital and may not be suitable for all investors. Leverage can work against you as well as for you. Before deciding to trade foreign exchange, carefully consider your investment objectives, level of experience, and risk appetite. Never risk money you cannot afford to lose, and always thoroughly backtest trading strategies on a demo account before risking live capital.