The Moving Average with Fractal Trading System For MT4 is a profitable trend continuation strategy based on Fractal's breakout. This trading strategy will focus on the price location where it is moving towards the trend. Moreover, this trading strategy is suitable for every currency pair and timeframe so that traders from every level can make money with this strategy.
📌 Strategy Summary & Key Parameters
- Strategy Name: The Moving Averege with Fractal Trading System For MT4
- Platform: MetaTrader 4 (MT4)
- Trading Style: Trend Following & Momentum Breakout
- Recommended Timeframes: M15, H1, H4, Daily
- Recommended Asset Classes: Major & Cross Currency Pairs (EUR/USD, GBP/USD, USD/JPY, EUR/JPY, GBP/JPY)
- Core Technical Tools: MetaTrader 4 Technical Indicators
- Risk Management: 1% to 2% risk per trade with 1:1.5+ Risk-Reward Ratio
What is Fractal?
Fractal is an MT4 indicator that indicates the possible price reversal point of a trend. Moreover, you can use this indicator to identify the minor reversal towards the primary direction to get the best output.

The Fractal indicator is made based on the Fractal price pattern, as shown below:
In the Fractal price pattern, there are 5 candles where the first 2 candles are in the opposite direction of the current trend, and the last 3 candles are the primary indication of price reversal.
The Fractal indicator is available on the Bill Williams tab from the Navigator section.
The interface of Fractal is above the price for sell indication and below the price for a bullish sign. Fractal is a lagging indicator; therefore, you should use other trading indicators (like Moving Averages) to increase the trading probability.
The Moving Average with Fractal Trading System For MT4
In this trading strategy, we will use the concept of average buyers and sellers activity in the price to determine the market direction. Later on, we will use Fractal to get the ultimate trading entry.
The moving average provides the exact outlook of the price by determining where the price is trading.
For example, if the price is trading above the SMA 100, it indicates that buyers are more robust than the seller in the last 100 candles. On the other hand, if the price is trading below the SMA 100, sellers are more potent than buyers based on the previous 100 candle's activity.
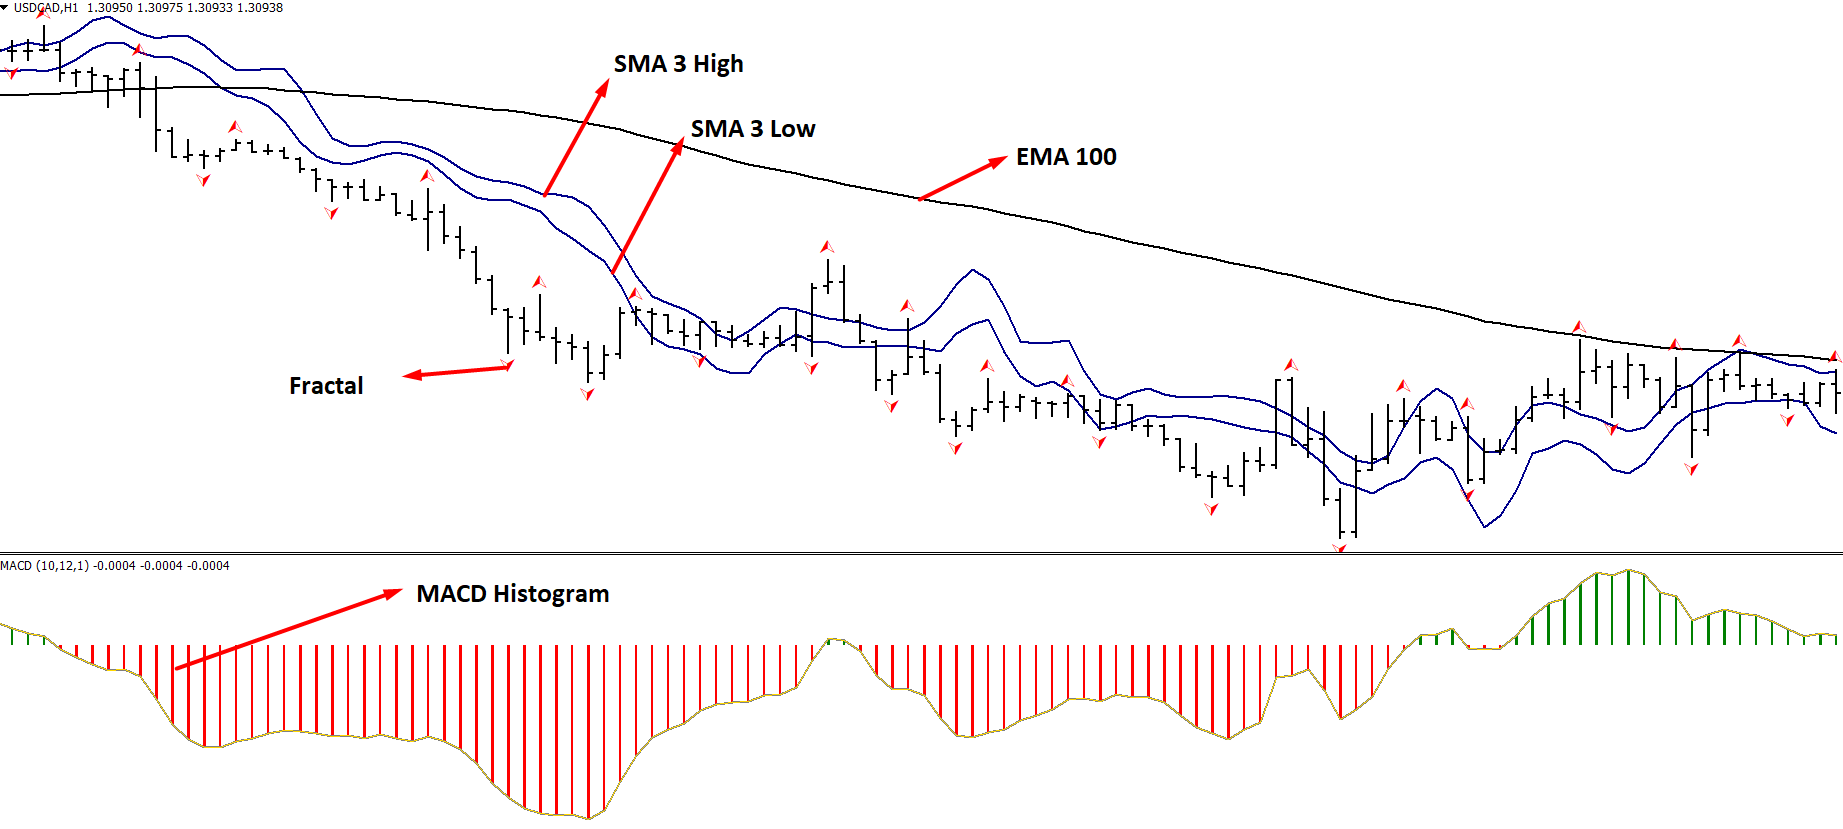
Before proceeding further about the trading strategy, let's have a look at the trading tools:
- Simple Moving Average (SMA)- value 3 (high)
- Simple Moving Average (SMA)- value 3 (low)
- Exponential Moving Average (EMA)- value 100 (close)
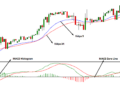
- Moving Average Convergence and Divergence( MACD)- value (10, 12, 1, 7)
Let's plot these indicators in the chart and see how it looks like:
The currency pair in the forex market moves like a zigzag; therefore, if you want to buy, you should buy from low, and if you're going to sell, you should sell from high.
In this trading strategy, we will sell the same value of SMA on multiple applications. Therefore, we will get the exact movement towards the trend. However, this trading strategy's main weakness is that it may provide false trading signals the market is extremely volatile.
Bullish Trading System
The Moving Average with Fractal Trading System For MT4 is profitable in any timeframe from 5 minutes to daily, and you can apply this strategy in every currency pair.
However, it is better to stick to the major and cross currency pairs to minimize the trading cost.
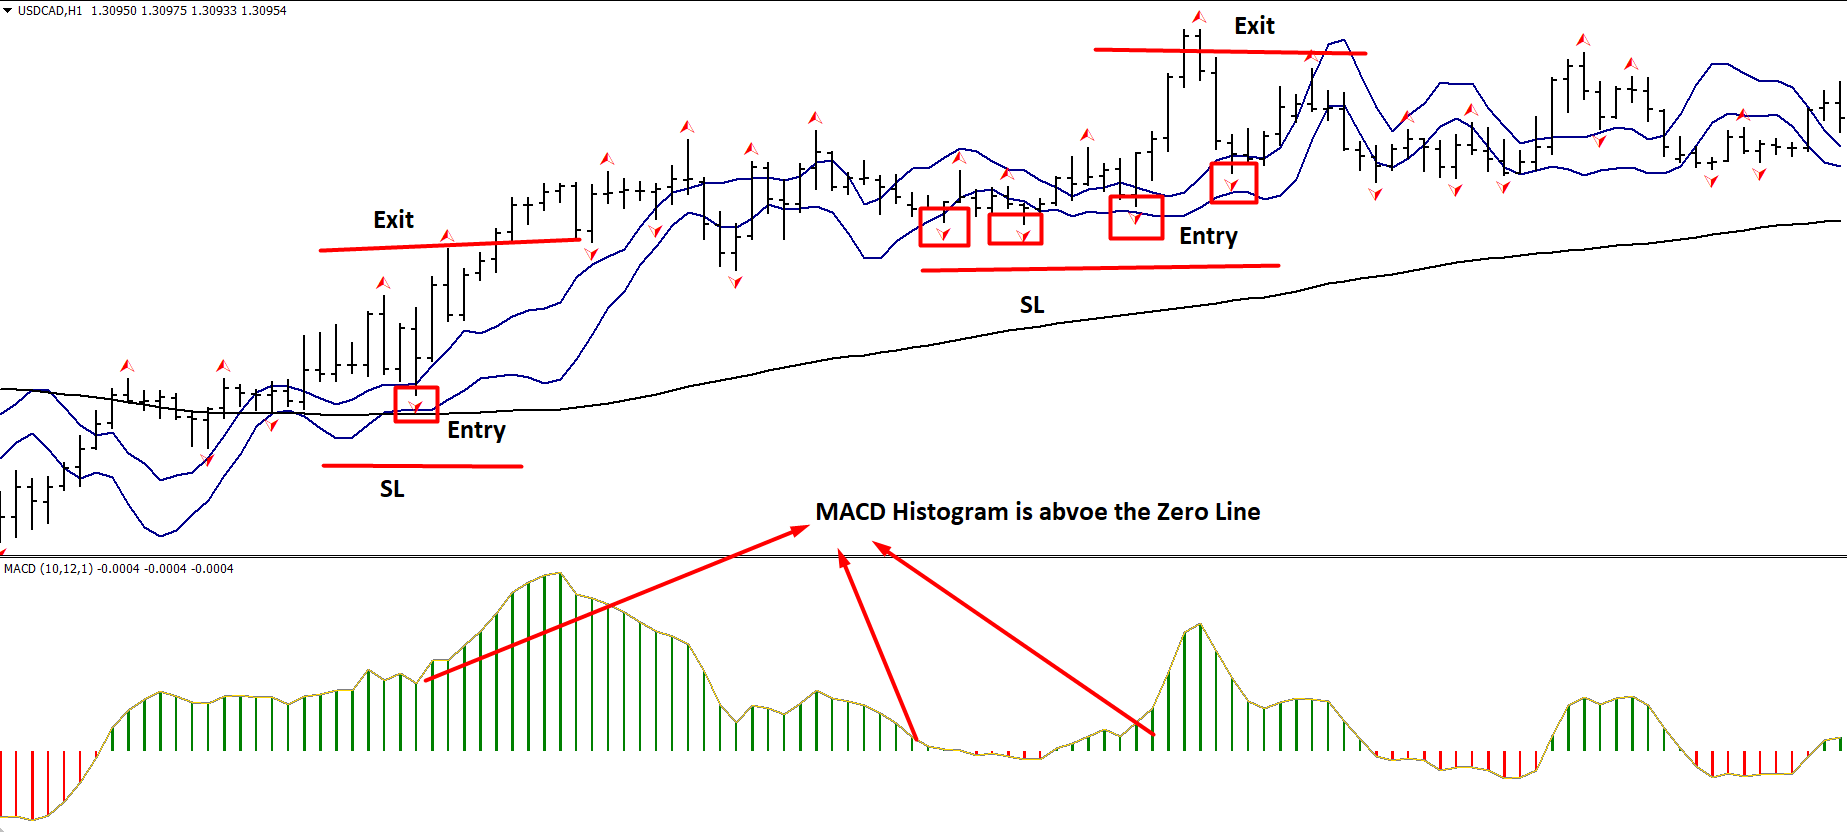
Bullish Trading Conditions
- The price is trending higher above the EMA 100, pointing out that the price is controlling by buyers'.
- The price is trending lower, and an up Fractal indicates that the price is likely to reverse towards the upside.
- MACD Histogram moves above the zero levels and points higher.
Entry
You should enter the trade only when the trading conditions are met. Later on, enter the trade as soon as a bullish candle appears from the up Fractal. Make sure to enter the trade after the candle closes.
Stop Loss
You can set the stop loss below the up Fractal with some buffer. Based on the timeframe and previous price action, you can follow these levels for stop loss:
- 5 Minutes Timeframe- 5 Pips below the SMA
- 15 Minutes Timeframe- 10 Pips below the SMA
- 30 Minutes Timeframe- 12 Pips below the SMA
- 1 Hour Timeframe- 20 Pips Below the SMA
- 4 Hour Timeframe- 30 Pips below the SMA
- Daily timeframe- 50 pips below the SMA
Take Profit
You can hold the trade as long as it is moving higher, and you can close the trade as soon as a bearish Fractal appears in the price, or it reached the SMA 3 (high) level.
Bearish Trading System
The bearish trading strategy is profitable in any timeframe from 5 minutes to daily, and you can apply this strategy in every currency pair.
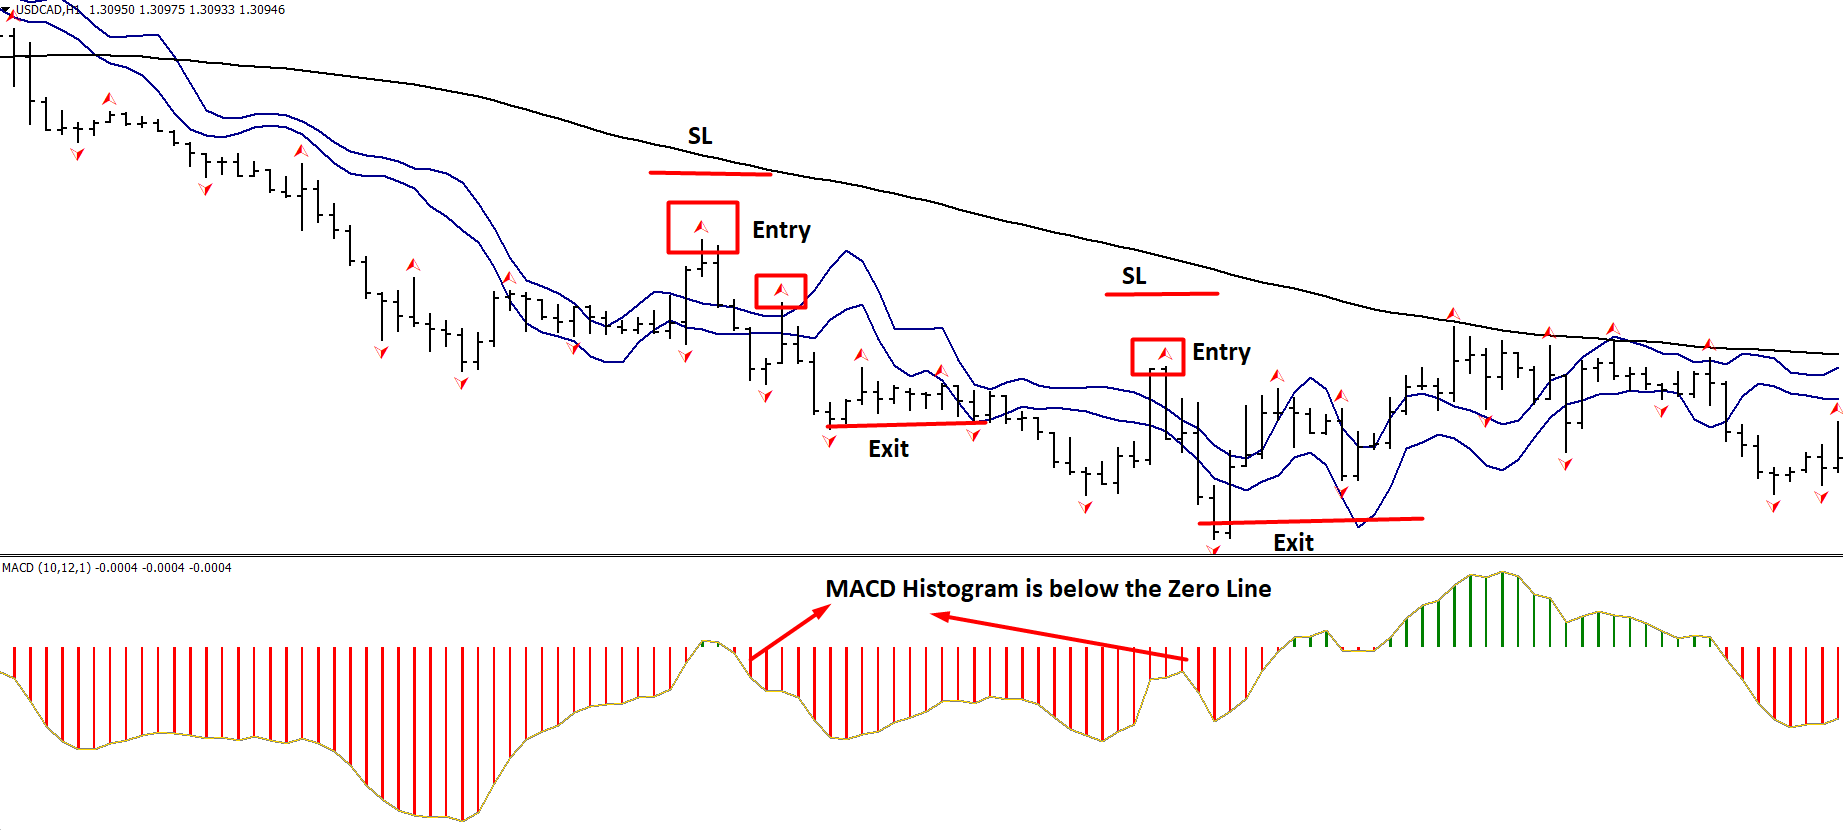
Bearish Trading Conditions
- The price is trending lower above the EMA 100, pointing out that the sellers' price is controlling.
- The price is trending higher, and a down Fractal appears, indicating that the price is likely to reverse towards the downside.
- MACD Histogram moves below the zero levels and points lower.
Entry
You should enter the trade only when the trading conditions are met. Later on, enter the trade as soon as a bearish candle appears from the down Fractal. Make sure to enter the trade after the candle closes.
Stop Loss
You can set the stop loss above the down Fractal with some buffer. Based on the timeframe and previous price action, you can follow these levels for stop loss:
- 5 Minutes Timeframe- 5 Pips below the SMA
- 15 Minutes Timeframe- 10 Pips below the SMA
- 30 Minutes Timeframe- 12 Pips below the SMA
- 1 Hour Timeframe- 20 Pips Below the SMA
- 4 Hour Timeframe- 30 Pips below the SMA
- Daily timeframe- 50 pips below the SMA
Take Profit
You can hold the trade as long as it is moving lower, and you can close the trade as soon as an up Fractal appears in the price or it reached the SMA 3 (high) level.
Conclusion- Trade Management Idea
In this trading strategy, trade management is an important part. You should move your stop loss at breakeven and close 50% of the trade after reaching 1:1 risk: reward. Moreover, you should keep your brain bias-free while you are analyzing the market.
The lot size is also an essential element that you should measure before taking the trade. The lot size should be based on a 2% risk per trade. Therefore, if you face a 5-6 consecutive loss, you have options to recover it.
💡 Professional Execution Tip:
Always wait for the trigger candlestick to fully close before entering a market position. Entering prematurely during an open candle frequently results in false breakouts and wick traps. In addition, avoid opening new positions during high-impact macroeconomic releases (e.g., US Non-Farm Payrolls or CPI announcements) when spread spikes and slippage can distort indicator signals.
🔗 Recommended Related Strategies & Indicator Guides
- Relative Vigour Index (RVI) Strategy: Learn how to optimize measuring trend conviction at key support and resistance zones on active market charts.
- Crypto Quad EMA (8, 13, 21, 55) Strategy: Master multi-moving average momentum and trend continuation for higher accuracy setups.
- The MultiTimeFrame Trading System with SMA and Bollinger Bands For MT4: Discover complementary rules and indicator setups to enhance your trading edge.
- The Pivot Points Trend Strategy For MT4: Explore alternative entry triggers and exit management for MT4 traders.
⚠️ Risk Warning: Foreign exchange and CFD trading carries a high level of risk to your capital and may not be suitable for all investors. Leverage can work against you as well as for you. Before deciding to trade foreign exchange, carefully consider your investment objectives, level of experience, and risk appetite. Never risk money you cannot afford to lose, and always thoroughly backtest trading strategies on a demo account before risking live capital.